Fig. 8
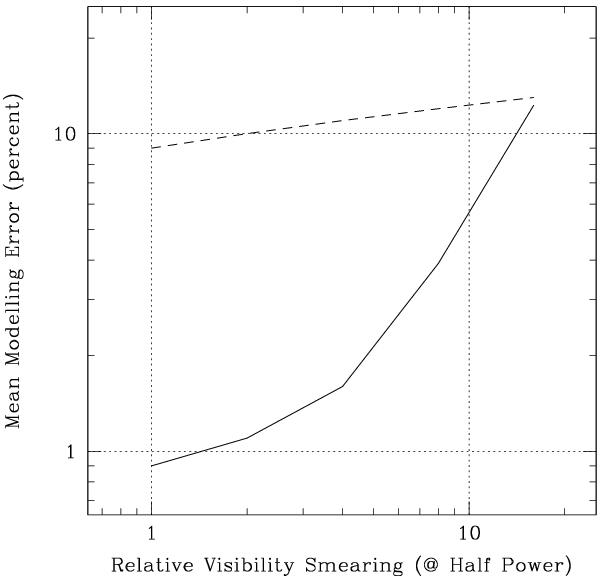
Mean source modelling error as function of the relative visibility smearing scale on the main beam flank. The reference smearing scale is taken to be 10% of the synthesised beam at half power of the main beam. The solid curve is a high precision model that likely represents a best case scenario, while the dashed curve is a simple model that is constrained to have only positive components.
Current usage metrics show cumulative count of Article Views (full-text article views including HTML views, PDF and ePub downloads, according to the available data) and Abstracts Views on Vision4Press platform.
Data correspond to usage on the plateform after 2015. The current usage metrics is available 48-96 hours after online publication and is updated daily on week days.
Initial download of the metrics may take a while.