Free Access
Fig. 5
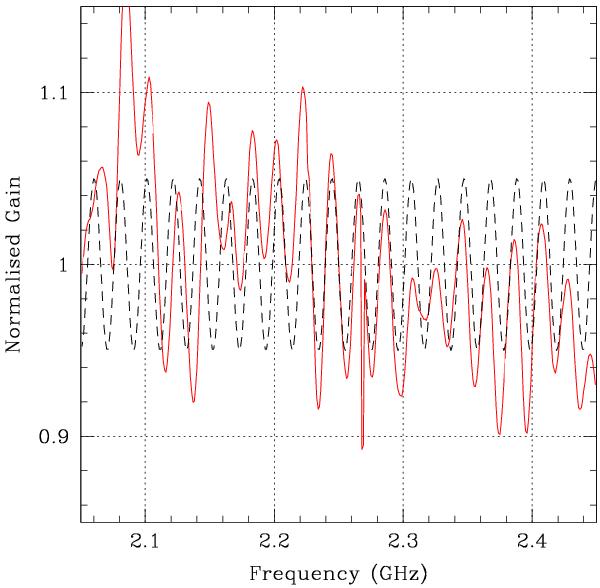
Normalised gain of the ATCA 22 m antennas as function of frequency. The solid curve is the mean gain over all interferometer baselines while the dashed curve is a sinusoid with 20.5 MHz periodicity and 5% peak modulation about the mean.
Current usage metrics show cumulative count of Article Views (full-text article views including HTML views, PDF and ePub downloads, according to the available data) and Abstracts Views on Vision4Press platform.
Data correspond to usage on the plateform after 2015. The current usage metrics is available 48-96 hours after online publication and is updated daily on week days.
Initial download of the metrics may take a while.