Fig. 1
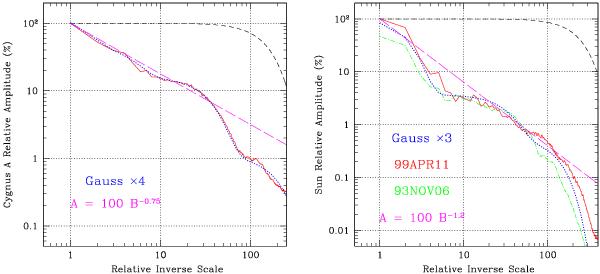
Relative visibility amplitude of Cygnus A (left) and the Sun (right) are shown as the solid curves. The short-dashed curve shows the point spread function of the observations, while the long-dashed curve a power-law approximation. The dotted curve is a sum of four (left) and three (right) Gaussians that approximates the measured spectra. Both the active (1999APR11) and quiet (1993NOV06) Sun are shown.
Current usage metrics show cumulative count of Article Views (full-text article views including HTML views, PDF and ePub downloads, according to the available data) and Abstracts Views on Vision4Press platform.
Data correspond to usage on the plateform after 2015. The current usage metrics is available 48-96 hours after online publication and is updated daily on week days.
Initial download of the metrics may take a while.