Fig. 4
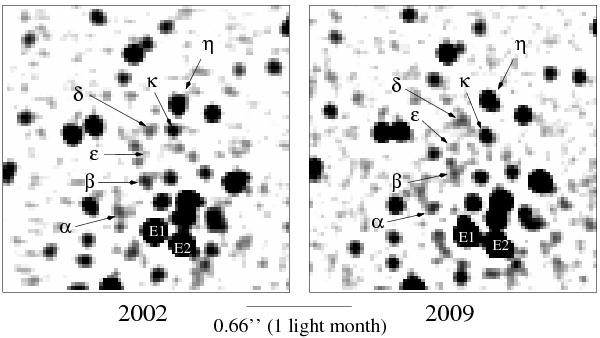
Ks-band identification of individual IRS13E and IRS13N sources at two different epochs and visualizations of the positions of the IRS13N sources α, β, δ, ϵ, η, and κ at two different epochs. The source labels in the high-pass filtered images correspond to those in Table 3.
Current usage metrics show cumulative count of Article Views (full-text article views including HTML views, PDF and ePub downloads, according to the available data) and Abstracts Views on Vision4Press platform.
Data correspond to usage on the plateform after 2015. The current usage metrics is available 48-96 hours after online publication and is updated daily on week days.
Initial download of the metrics may take a while.