Fig. A.10
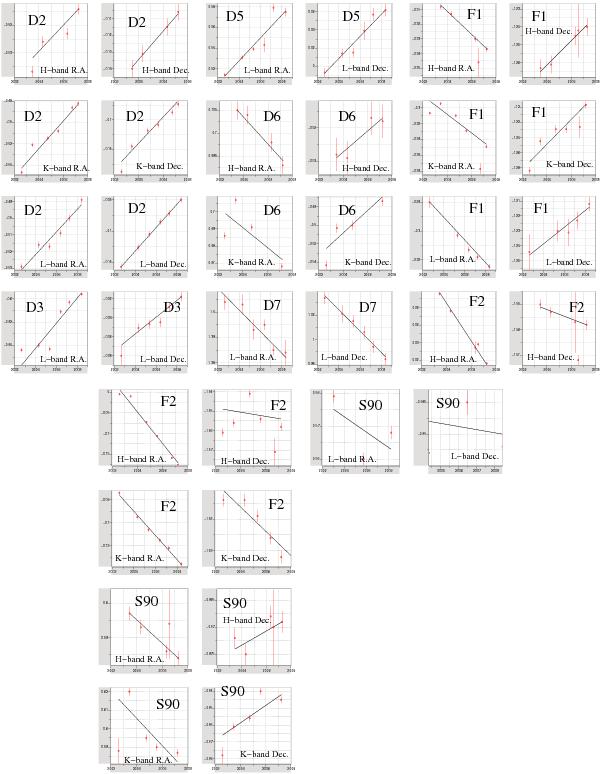
Proper motions of infrared excess sources in the central 2′′ close to SgrA*. Offsets in RA and Dec in milliarcseconds are plotted against the time in years. Source labels and observing bands are given as indicated in Fig. 1 and Table 4. The source positions agree to within better than about ± 25 mas, i.e., a quarter of the L′-band beam. The motions obtained at different wavebands agree within the uncertainties. For sources for which S-star identifications are given, the positions and motions agree on average to within about 30 mas and 150 km s-1.
Current usage metrics show cumulative count of Article Views (full-text article views including HTML views, PDF and ePub downloads, according to the available data) and Abstracts Views on Vision4Press platform.
Data correspond to usage on the plateform after 2015. The current usage metrics is available 48-96 hours after online publication and is updated daily on week days.
Initial download of the metrics may take a while.