Fig. A.9
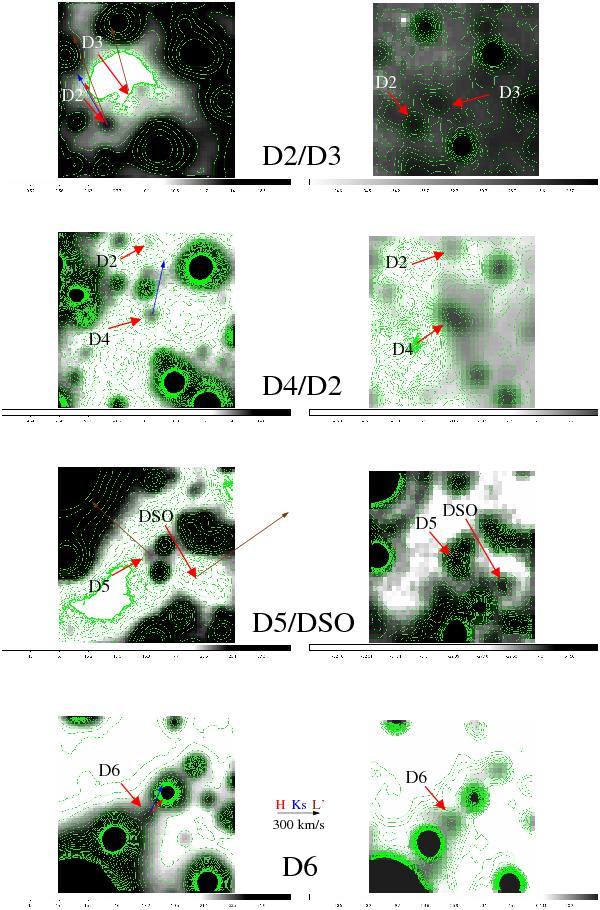
Comparison of the Ks- (left) and L′-band (right) identifications. L′-band excess sources in the field around SgrA* as shown in the overview map in Fig. 1 and listed in Table 4. The arrow color-coding for the observing bands and the proper motions are given between the images in the lower part of the panel. The 2004 map sizes are 0.932′′ × 0.932′′ (70 × 70 pixels) in the Ks-band and 0.945′′ × 0.945′′ (35 × 35 pixels) in the L′-band. We have indicated the sources with arrows and labels. The gray-scaling is given in bars and the contours are logarithmically spaced and given for display purposes only. The DSO is visible at the lowest contour levels in the appropriate plot in Fig. A.9. In Fig. A.9 we marked the region in which D7 is located with a dashed circle. Some contour excursions are visible, but no clear detection of a compact source is possible. For source D4/X7 see Muzic et al. (2010).
Current usage metrics show cumulative count of Article Views (full-text article views including HTML views, PDF and ePub downloads, according to the available data) and Abstracts Views on Vision4Press platform.
Data correspond to usage on the plateform after 2015. The current usage metrics is available 48-96 hours after online publication and is updated daily on week days.
Initial download of the metrics may take a while.