Fig. 14
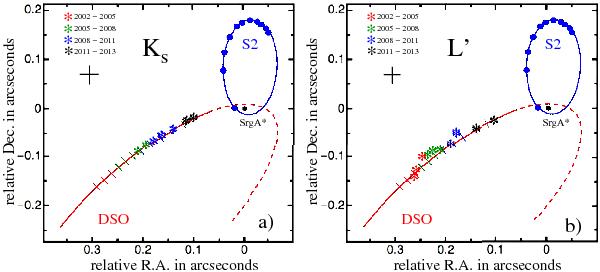
Positions of the DSO relative to S2 and SgrA* plotted in comparison to the orbital tracks provided by Gillessen et al. (2012a) (red for the DSO, blue for S2, SgrA* is at the position of the black dot at the origin). The results for the Ks- and L′-band are shown in panels a) and b) (see data in Table 5). Thin lines indicate the approximate expected positions of the DSO on its orbit from 2002.0 to 2012.0 (based on our L′-band reductions and Gillessen et al. 2012a). The epochs are color-coded and the measurement uncertainty is shown as a black cross (see A.6 in the appendix).
Current usage metrics show cumulative count of Article Views (full-text article views including HTML views, PDF and ePub downloads, according to the available data) and Abstracts Views on Vision4Press platform.
Data correspond to usage on the plateform after 2015. The current usage metrics is available 48-96 hours after online publication and is updated daily on week days.
Initial download of the metrics may take a while.