Fig. 15
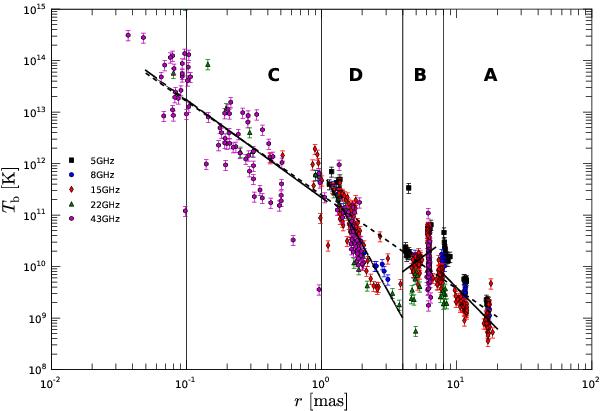
Variation in the brightness temperature, Tb with distance along the jet for all available epochs and cross-identified components (presented in Tables A.6). The nearly vertical variation within 6 mas < r < 8 mas in region B reflect the temporal variation in the size of the fitted Gaussians. The solid lines correspond to power-law fits Tb ∝ ra to the individual regions, and the dashed line to a power-law fit to the entire range 0.1 mas < r < 20 mas, which leads to an exponent a = −1.8 (see text).
Current usage metrics show cumulative count of Article Views (full-text article views including HTML views, PDF and ePub downloads, according to the available data) and Abstracts Views on Vision4Press platform.
Data correspond to usage on the plateform after 2015. The current usage metrics is available 48-96 hours after online publication and is updated daily on week days.
Initial download of the metrics may take a while.