Fig. 3
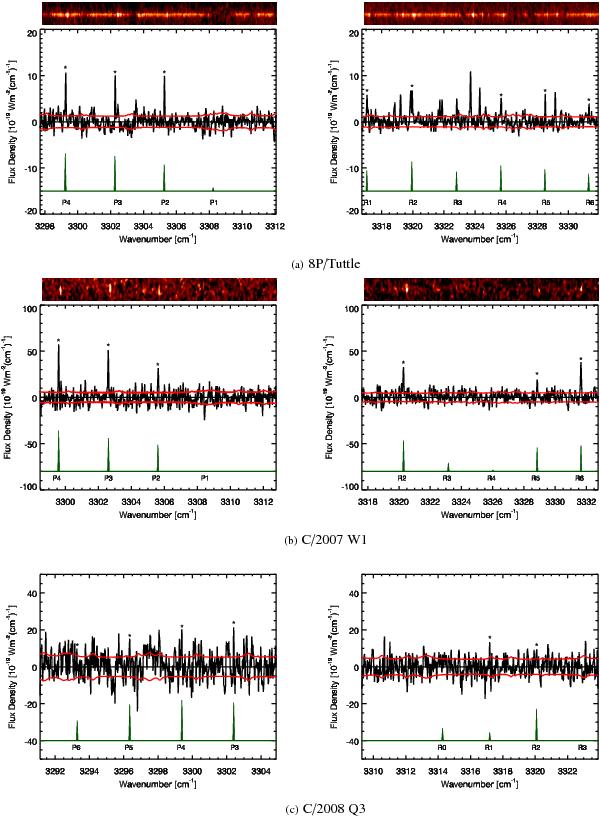
Detection of HCN in the observed comets. For each spectrum the red line represents the ±1σ error. The model, Doppler-shifted and affected by transmittance, is plotted below the observed spectra; identified lines are indicated with a star. For comet C/2008 Q3 we omitted the echellograms, since they were too noisy to clearly distinguish the HCN emission lines.
Current usage metrics show cumulative count of Article Views (full-text article views including HTML views, PDF and ePub downloads, according to the available data) and Abstracts Views on Vision4Press platform.
Data correspond to usage on the plateform after 2015. The current usage metrics is available 48-96 hours after online publication and is updated daily on week days.
Initial download of the metrics may take a while.