Fig. 1
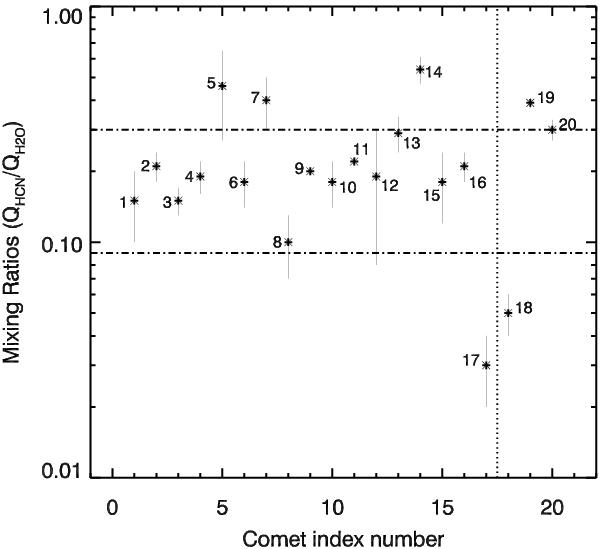
Comparison of HCN content measured in the IR, among different comets. The dashed-dotted lines separate HCN depleted, HCN normal, and HCN enriched comets, while the dotted vertical line separate comets reported elsewhere (left) from those reported in this paper (right). The comets in the plot are 1. C/2004 Q2, 2. C/1999 H1, 3. C/2000 WM1, 4. C/2006 P1, 5. C/2001 A2, 6. C/1996 B2, 7. C/1995 O1, 8. C/1999 S4, 9. 1P/Halley, 10. 153P/Ikeya-Zhang, 11. 21P/Giacobini – Zinner (upper limit), 12. 73P/Schwassmann-Wachmann – Fragment C, 13. 73P Schwassmann-Wachmann – Fragment B, 14. 17P/Holmes (outburst), 15. 9P/Tempel 1 (pre impact), 16. 9P/Tempel 1 (post impact), 17. 6P/D’Arrest, 18. 8P/Tuttle, 19. C/2007 W1, 20. C/2008 Q3; (see Lippi 2010 and references therein).
Current usage metrics show cumulative count of Article Views (full-text article views including HTML views, PDF and ePub downloads, according to the available data) and Abstracts Views on Vision4Press platform.
Data correspond to usage on the plateform after 2015. The current usage metrics is available 48-96 hours after online publication and is updated daily on week days.
Initial download of the metrics may take a while.