Fig. 5
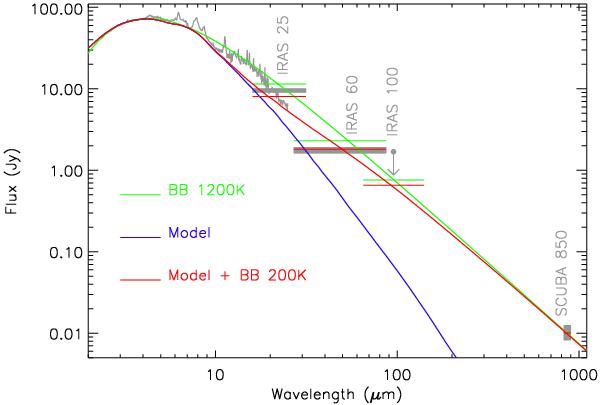
Spectral energy distribution of HR 4049. The ISO-SWS spectrum (grey line), and IRAS 25, 60, and 100 μm, and SCUBA 850 μm photometry (grey boxes). The green line is the fit with a single blackbody (1200 K, in accordance with Dominik et al. 2003). The spectral energy distribution of our model (blue) underestimates the flux at λ > 20 μm. The red line shows our model plus a 200 K blackbody, scaled to the SCUBA 850 μm flux. See Sect. 7 for details.
Current usage metrics show cumulative count of Article Views (full-text article views including HTML views, PDF and ePub downloads, according to the available data) and Abstracts Views on Vision4Press platform.
Data correspond to usage on the plateform after 2015. The current usage metrics is available 48-96 hours after online publication and is updated daily on week days.
Initial download of the metrics may take a while.