Fig. 14
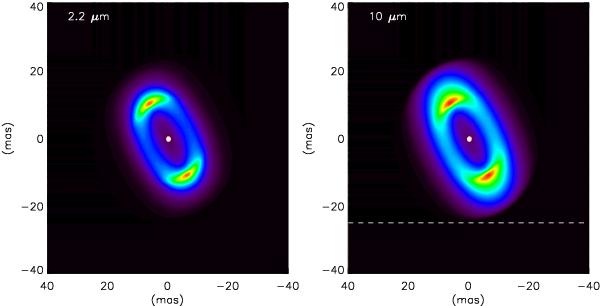
Best-model image at 2.2 and 10 μm. North is up, east is left. At a distance of 640 pc, 1 mas corresponds to 0.64 AU. The dashed line in the right panel indicates the photocenter location of the PAH 11.3 μm emission region relative to the disk center, projected on the N − S axis (xns). The photocenter position in the E − W direction is not constrained (see Sect. 8.2.2).
Current usage metrics show cumulative count of Article Views (full-text article views including HTML views, PDF and ePub downloads, according to the available data) and Abstracts Views on Vision4Press platform.
Data correspond to usage on the plateform after 2015. The current usage metrics is available 48-96 hours after online publication and is updated daily on week days.
Initial download of the metrics may take a while.