| Issue |
A&A
Volume 551, March 2013
|
|
|---|---|---|
| Article Number | A12 | |
| Number of page(s) | 6 | |
| Section | Stellar structure and evolution | |
| DOI | https://doi.org/10.1051/0004-6361/201118756 | |
| Published online | 11 February 2013 | |
High-precision CoRoT space photometry and fundamental parameter determination of the B2.5V star HD 48977
1
Institut d’Astrophysique et de Géophysique, Université de
Liège,
17 Allée du 6 Août,
4000
Liège,
Belgium
e-mail: This email address is being protected from spambots. You need JavaScript enabled to view it.
2
Instituut voor Sterrenkunde, K.U. Leuven, Celestijnenlaan
200D, 3001
Leuven,
Belgium
3
LESIA, Observatoire de Paris, CNRS UMR 8109, Université Pierre et
Marie Curie, Université Denis Diderot, 5 place J. Janssen, 92105
Meudon,
France
4
Department of Astrophysics/IMAPP, Radboud University
Nijmegen, PO Box
9010, 6500 GL
Nijmegen, The
Netherlands
5
Institut d’Astrophysique Spatiale, CNRS/Université Paris XI UMR
8617, 091405
Orsay,
France
6
Kavli Institute for Theoretical Physics, Kohn Hall, University of
California, Santa
Barbara
CA
93106-4030,
USA
Received: 28 December 2011
Accepted: 5 December 2012
Abstract
We present the CoRoT light curve of the bright B2.5V star HD 48977 observed during a short run of the mission in 2008, as well as a high-resolution spectrum gathered with the HERMES spectrograph at the Mercator telescope. We use several time series analysis tools to explore the nature of the variations in the light curve. We performed a detailed analysis of the spectrum of the star to determine its fundamental parameters and its element abundances. We find a large number of high-order g-modes, and one rotationally induced frequency. We find stable low-amplitude frequencies in the p-mode regime as well. We conclude that HD 48977 is a new slowly pulsating B star with fundamental parameters found to be Teff = 20 000 ± 1000 K and log g = 4.2 ± 0.1. The element abundances are similar to those found for other B stars in the solar neighbourhood. HD 48977 was observed during a short run of the CoRoT satellite implying that the frequency precision is insufficient to perform asteroseismic modelling of the star. Nevertheless, we show that a longer time series of this star would be promising for such modelling. Our present study contributes to a detailed mapping of the instability strips of B stars in view of the dominance of g-mode pulsations in the star, several of which occur in the gravito-inertial regime.
Key words: asteroseismology / stars: individual: HD 48977 / stars: abundances / stars: fundamental parameters / stars: oscillations / techniques: photometric
Research Associate, Fond de la Recherche Scientifique (F.R.S.-FNRS).
Postdoctoral Fellow, Fund for Scientific Research of Flanders (FWO).
Postdoctoral Fellow, Fond de la Recherche Scientifique (F.R.S.-FNRS).
© ESO, 2013
1. Introduction
Asteroseismology, the study of stellar oscillations to infer information about the stellar structure, is a very powerful tool for improving our knowledge of the physics of stellar interiors (Aerts et al. 2010). Helioseismology, the seismology of the Sun, has helped tremendously in improving our knowledge of the Sun’s structure and interior physics (Christensen-Dalsgaard 2002). Asteroseismology is a younger but very dynamic field in astronomy, and several recent space missions, in particular MOST, CoRoT, and Kepler, have provided high-precision light curves for several classes of variable stars, including main sequence B stars (e.g., Aerts et al. 2006a,b; Saio et al. 2007; Cameron et al. 2008; Huat et al. 2009; Neiner et al. 2009; Diago et al. 2009; Gutiérrez-Soto et al. 2009; Degroote et al. 2009, 2010, 2011; Pápics et al. 2011; Balona et al. 2011). Despite these high-precision data from space, in-depth seismic modelling of most of these pulsating B stars must await (partial) identification of the wavenumbers of the dominant observed pulsation frequencies. This has only been achieved so far for the slowly pulsating B (hereafter SPB) star HD 50230, which led to the conclusion that this star has an inhomogeneously mixed region surrounding its core (Degroote et al. 2010), and for the β Cep star HD 180642 (V1449 Aql), which has an unusually high-amplitude dominant radial mode that induces several other lower amplitude non-radial modes of the star through resonant mode coupling (Briquet et al. 2009; Aerts et al. 2011).
In the past decade, several asteroseismic studies of B stars based on large ground-based campaigns have been performed as well (Aerts et al. 2003a,b, 2004b, Handler et al. 2004, 2005, 2006; Aerts et al. 2004a; De Ridder et al. 2004; Jerzykiewicz et al. 2005; Dziembowski & Pamyatnykh 2008; Briquet et al. 2005; Desmet et al. 2009). These observations are very extensive and complicated, often involving multi-site multi-technique campaigns. Pulsating B stars typically pulsate with low-order p and g modes and some also experience high-order g modes, making it necessary to observe them for a very long time in order to resolve all those modes. In addition, daily aliases are an observational difficulty since these stars often have (beat) periods close to a day. Nevertheless, ground-based asteroseismic studies of B stars have proven to be very successful and have led to important new insights into their interior physics. For example, it was possible to put limits on the value of the overshooting parameter of the core (Ausseloos et al. 2004; Dupret et al. 2004; Briquet et al. 2007; Desmet et al. 2009). From partially resolved multiplets due to rotational splitting, it was also possible to show that some of those stars have non-rigid rotation, in the sense that their core regions rotate faster than their envelope (Pamyatnykh et al. 2004; Ausseloos et al. 2004; Dziembowski & Pamyatnykh 2008). Finally, the seismic modelling of those B stars provided values for their fundamental parameters, such as the effective temperature, log g, and age.
In this paper we are concerned with data assembled with the CoRoT (Michel et al. 2006) satellite. Its main asteroseismology mission is to observe a limited number of bright main sequence stars during a long time span of a maximum of five months, but between those long runs shorter ones of some three to five weeks also occur. Because of the success of the ground-based asteroseismology of B stars, several B stars with a variety of spectral type were selected as targets for CoRoT, with the aim of mapping the instability strips of the β Cep and SPB stars.
This paper is devoted to HD 48977, a B2.5V star (V magnitude of 5.92), which was observed by CoRoT as a secondary asteroseismology target during a short run in 2008. Its spectral type of B2.5V places it in the joint region of the SPB and β Cep instability strip. Very little was known about this star prior to the CoRoT observations. It had been flagged as a potential rotationally or pulsationally variable star, and it was observed by Hipparcos, which led to a main frequency peak at 0.5218 d-1 (Koen & Eyer 2002). Estimates of its fundamental parameters using colour indices were given in Lyubimkov et al. (2002) as Teff = 17 500 ± 300, log g = 4.09 ± 0.08, from which the authors deduced M = 5.7 ± 0.3 M⊙, R = 3.6 ± 0.4 R⊙, an age of 30.6 ± 10.7 × 10⁶ yrs, and d = 252 ± 40 pc using Claret (1995) evolutionary tracks.
2. CoRoT high-precision photometry of HD 48977
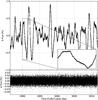 |
Fig. 1 CoRoT light curve of HD 49877, with an inset to show the short-time behaviour. The bottom panel represents the residuals after prewhitening with a model based on the 55 frequencies listed in Table 1. |
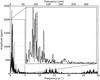 |
Fig. 2 Fourier transform of the light curve. |
HD 48977 was observed by CoRoT with a cadence of 32 s during a short run in 2008, from 2 454 531.48027 JD (5 May) to 2 454 556.76361 (31 May), i.e., during some 25 days. The detrended light curve is shown in Fig. 1. It was obtained by fitting the light curve with a linear polynomial and dividing the light curve by this polynomial in order to convert to flux units and compensate for the loss of gain in the satellite CCD (Auvergne et al. 2009).
Searching for frequencies in the light curve was done independently by A.T. (A. Thoul) using Period04 (Lenz & Breger 2005) and by P.D. (P. Degroote) using the method in Degroote et al. (2009). The Fourier transform is shown in Fig. 2. It can be seen that the dominant signal occurs in the range below 3 d-1, which is typical of g-mode pulsations in early B stars. The two methods give the same list of frequencies (within the resolution). The resulting 55 frequencies found to have an amplitude more than four times the noise level are listed in Table 1. The main peak has a frequency of 0.5167 d-1, very close to the frequency 0.5218 d-1 of the Hipparcos light curve (Koen & Eyer 2002). We see that HD 48977 presents a rich spectrum dominated by g modes with frequencies between 0.1 d-1 and 1.5 d-1. We thus classify HD 48977 as a new SPB star.
An amplitude drop with a factor more than two occurs for the frequencies 35 to 55 in Table 1, which represent power in the p-mode regime, compared to the lower frequency regime (Fig. 2). While these 20 listed frequencies above 10 d-1 are significant, we are cautious about their interpretation because they occur in the region where instrumental power also occurs (Auvergne et al. (2009), see also Fig. 2). In particular, the two highest frequencies in Table 1 are twice and five times the orbital frequency of the satellite. Four additional peaks in Table 1 coincide with (daily aliases of) the satellite orbital frequency, keeping in mind the relatively large frequency uncertainty. Nevertheless, significant intrinsic stellar frequencies occur in the region [10, 20] d-1. As is also the case for the pulsators HD 50230 (B3V, Degroote et al. 2010) and HD 43317 (B3IV, Pápics et al. 2012), the frequency structure in that regime is rather stable, pointing towards p modes excited by the kappa mechanism. The autocorrelation of the power spectrum peaks at a possible frequency separation of 1.55 d-1, but, in view of the limited frequency precision and the unknown identification of the spherical wavenumbers of the modes, we refrain from further interpretation of the frequencies in this regime with the present data set at hand. The noise level in the residual amplitude spectrum, measured between 5 and 10 d-1, amounts to only 1 ppm.
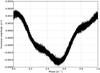 |
Fig. 3 Phase plot of the rotational signal, where all signals not related to the rotational frequency and its harmonics have been filtered out. |
Given that the harmonics of the fourth frequency f4 = 0.637 d-1 are clearly present in the frequency spectrum, while there are no harmonics for any of the other frequencies, and given that the shape of the curve in the phase diagram is not typical of nonlinear pulsations (see Fig. 3), we interpret f4 as the rotation frequency of the star. Also this particular aspect of the frequency spectrum is similar for the B3IV pulsator HD 43317 (Pápics et al. 2012), although the data set of the latter star is much more conclusive on this matter, given that this target was observed during a long run of CoRoT.
Frequencies in the light curve of HD 48977.
The frequency resolution deduced from the CoRoT light curve is given by 1.5/ΔT ≃ 0.06 d-1, where T is the entire duration of the observation run, i.e., 25 days. Unfortunately, this is close to the separation between the observed g-mode frequencies (see Table 1). This prevented us from detecting any meaningful period spacings, as deduced for HD 50230 by Degroote et al. (2010), because those spacings would be nearly the same as the frequency resolution itself.
The frequency spectrum we have at hand has too low precision to perform a meaningful seismic modelling of this star. This is not surprising, because SPB stars are known to need observations of several months before the frequency spectrum can be deduced with sufficient precision to interpret it in terms of predicted frequencies from theoretical models. The selection of this secondary seismology target for a short run was based on its rough position in the instability strips, which could have implied the detection of dominant high-amplitude p modes. A good strategy for further understanding the target would be to observe it again with CoRoT during a medium- to long-run of several months.
3. Spectroscopy of HD 48977
One high-resolution, high signal-to-noise spectrum of HD 48977 was obtained using the HERMES spectrograph (Raskin et al. 2011) at the Mercator Telescope. The normalized spectrum for the spectral range 4065−4155 Å is shown in Fig. 4. It has a resolving power of 80 000 and an S/N of about 170 in the region near the Si II doublet at 4128, 4130 Å which is a spectral range most often used to study the oscillations of SPB stars (Aerts et al. 1999). From the Fourier transform of the SiIII 4567 line, which allows for disentangling non-rotational broadening from other broadening mechanisms (i.e., pulsations, micro- and macroturbulence, Simón-Díaz & Herrero 2007), we deduce vsin i = 29 ± 1 km s-1. Combined with the interpretation of f4 as the rotation frequency and a canonical radius of B-type stars in this part of the Hertzsprung-Russell diagram (R = 3.5 ± 0.7 R⊙, obtained from a grid of models calculated using CLES (Scuflaire et al. 2008)), we derive an inclination angle i = 15 ± 3°, or a true equatorial velocity veq = 113 ± 23 km s-1.
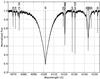 |
Fig. 4 Excerpt of the high-resolution high signal-to-noise spectrum (black) of HD 48977, obtained with the HERMES spectrograph attached to the Mercator Telescope. Grey lines indicate the zero-rotation line depths of a template spectrum with Teff = 20 000 K and log g = 4.2 dex (solar mixture and solar metallicity). |
We performed a detailed analysis of the spectrum of HD 48977 using the method explained in Morel et al. (2006) to determine the fundamental parameters and the element abundances of the star. The synthetic spectra used have been computed using an updated version of the non-LTE (local thermodynamics equilibrium) line-formation codes DETAIL/SURFACE (Butler & Giddings 1985; Giddings 1981).
Si lines used to determine the effective temperature in B stars.
After normalizing the spectrum, we measured the ratios of the equivalent widths (EWs) of the different ionization lines of Si, in order to obtain rough estimates of the effective temperature. Some Si lines appropriate for use in the case of B stars are listed in Table 2. Among those lines, all four Si II lines are present in the spectrum of HD 48977, while only three Si III lines are present and no Si IV lines. The lines present in the spectrum of HD 48977 are underlined in Table 2. Following Simón-Díaz (2010), some of those lines are badly understood from the viewpoint of atomic data and are better avoided in the analysis. Those lines are indicated in italics in Table 2. Looking at this table, we see that we can use only one Si II line and three Si III lines. The ratios of the EWs of the Si II and Si III lines are shown in Fig. 5 for log g = 4.2. The theoretical ratios are shown for two values of the microturbulence, namely ξ = 1 km s-1 and ξ = 5 km s-1, and for four values of the Si abundance, log ϵ(Si) = 7.54, 7.34, 7.14, 6.94 dex. This gives an estimate for the effective temperature of Teff = 19 900 ± 400 K. Given that we have so few suitable Si lines, and for completeness, we did the same analysis using all the observed Si lines. From the lines that should not be used according to Simón-Díaz (2010), we get higher values for the effective temperature, up to 22 000 K. This is consistent with the general trend reported by Simón-Díaz (2010).
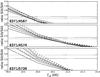 |
Fig. 5 Theoretical EW ratios for log g = 4.2 of the suitable Si II and Si III lines in the spectrum with proper atomic data. Theoretical values are plotted for two values of the microturbulence, ξ = 1 km s-1 (full lines) and ξ = 5 km s-1 (dashed lines), and four values of the Si abundance, log ϵ(Si) = 7.54, 7.34, 7.14, 6.94 dex. The two horizontal lines represent the observed values with their error bar. |
The next step is to find the best value for log g by fitting the wings of the Balmer lines. We use the Hβ, Hγ, Hδ, Hϵ, and Hα lines. We find the best fit for log g = 4.2 ± 0.1 assuming log Teff = 20 000 ± 1000 K. In Fig. 6, we show HD 48977 in the B star instability strips. We see that it falls nicely into the SPB instability region.
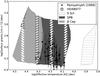 |
Fig. 6 Instability strips for B stars, as well as observed SPB stars from ground-based surveys (dots) taken from Pamyatnykh (1999). The position of HD 48977 is indicated as a square. |
In principle, the value for the microturbulence parameter can be found by looking at strong and weak lines of a given ion and by requiring that they yield the same abundances. Unfortunately, all O lines in the spectrum of HD 48977 are weak, so we cannot determine the value of the microturbulence. It is, however, expected to be small for this spectral type. We included the unknown value of the microturbulence parameter for the element abundances by increasing the error bars based on two possible values of ξ = 1 km s-1 and ξ = 5 km s-1.
To refine the estimate of the effective temperature, we required the Si II and Si III lines to return on average the same abundance. Using the Si lines underlined in Table 2, we obtain a value consistent with the previous estimate and log ϵ(Si) = 7.27 ± 0.20 dex.
We can now obtain the abundances of the other elements with lines in the spectrum. The lines used for the analysis and the results obtained for the abundances are summarized in Table 3. The abundance uncertainties take both the line-to-line scatter and the errors arising from the uncertainties in the atmospheric parameters into account. They are in very good agreement with the abundances found for O and B stars in the solar neighourhood by Morel et al. (2006) using exactly the same methods and tools. The Ne abundance is found to be 7.96 dex, a value intermediate between the solar values recommended by Grevesse & Sauval (1998) and Asplund et al. (2009). Morel & Butler (2008) obtained a very similar Ne abundance for B stars.
The CNO abundance ratios are found to be [N/O] = −0.92 and [N/C] = −0.61, which are equal to the solar values within the errors. We thus do not find any indication of deep mixing in HD 48977. Such mixing was found for several among the bright β Cep stars (Morel et al. 2006), which are somewhat hotter than HD 48977.
4. Photometric determination of the effective temperature
The visual magnitude of HD 48977 makes it an optimal target for inclusion in wide-field surveys. We collected absolute photometry in the UV (TD1, ANS, Thompson et al. 1978; Wesselius et al. 1980, 1982), the optical (Strømgren, Geneva, Johnson and Tycho, Mermilliod et al. 1997; Rufener 1988; Rufener & Nicolet 1988; Ofek 2008; Mermilliod 1986; Høg et al. 2000) and the (near) infrared (Johnson, 2MASS, WISE, AKARI, Cutri et al. 2003, 2011; Wright et al. 2010; Ishihara et al. 2010). From the WISE bands at 3.4 μm (W1), 4.6 μm (W2), 12.3 μm (W3), and 22 μm (W4) and AKARI photometry at 8.7 μm, we see no signs of infrared excess.
Even though it is well known that fundamental parameters determined from SEDs based on photometric data are usually less precise than those deduced from high-resolution spectroscopy, we estimated the effective temperature and gravity via the procedure outlined in Degroote et al. (2011), as a compatibility check. We chose to fit the absolute fluxes in the infrared (λ > 1 μm), and only colours at shorter wavelengths (cf. the infrared flux method Blackwell et al. 1979) (Fig. 7). We used both LTE (Castelli & Kurucz 2003) and NLTE model atmospheres (Lanz & Hubeny 2007). We deduced an effective temperature Teff = 18 000 ± 1300 K (95% confidence interval), surface gravity log g > 3.6, interstellar exctinction E(B − V) < 0.025, angular diameter θ = 0.128 ± 0.004 mas, and a solar or sub-solar metallicity. We thus find that the photometric method underestimates the effective temperature by roughly 1000 K compared to the silicon line ratios (Fig. 5), but the values are consistent within 2σ. Given the much higher quality of the HERMES spectrum compared to broad-band photometry, we adopt the spectroscopic estimate of the effective temperature.
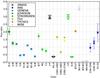 |
Fig. 7 Observed and model photometric colours of HD 48977. Crosses denote the synthetic flux of the best fitting model, circles denote the observations and their errors. Filled circles are included in the fit as colors (optical and UV), open circles are included as absolute photometry (infrared). |
5. Conclusions
From 25d of CoRoT high-precision space photometry, we found the B2.5V star HD 48977 to be a new SPB star. In fact, it is the hottest confirmed SPB star known to date. In agreement with the star’s position in the joint part of the β Cep and SPB instability strips, we detected numerous dominant g modes and low-amplitude p modes in its oscillation spectrum. The g modes occur in the frequency range 0.17−3.0 d-1 and reach a maximum amplitude of 2000 ppm. The ratio of the p- and g-mode amplitudes of this moderately rotating star of solar metallicity is less than 0.025. In this aspect, the three stars HD 48977 (B2.5V, moderate rotator; this paper), HD 50230 (B3V, slow rotator; Degroote et al. (2010)) and HD 43317 (B3IV, fast rotator; Pápics et al. (2012)) are very comparable.
While the frequency precision is insufficient to perform forward modelling at this stage, an interesting aspect of HD 48977’s variability is that we detected rotational modulation, in addition to the g-mode oscillations, in its photometric light curve, again similar to the case of HD 43317. The combination of the rotation frequency we found in the CoRoT light curve and the overall line broadening in the spectrum, implies that HD 48977 is one of the very few moderate rotators known within the class of SPB stars so far, the B3V star HD 43317 being an even faster rotator (Pápics et al. 2012).
The rotation frequency of 0.6372 d-1 is similar to the g-mode frequencies and implies that any future seismic modelling of the star must take the effects of rotation in the pulsation description into account. While this can be done using the traditional approximation for modes whose frequency is above twice the rotation frequency (Aerts & Dupret 2012; Ballot et al. 2012), the lowest frequency modes of HD 48977 correspond to so-called gravito-inertial waves and require a treatment that does not rely on perturbative methods (Ballot et al. 2010).
Our findings show that HD 48977 would be an excellent target for a long run during an extension of the CoRoT mission. This would probably allow us to decide on the nature of the power in the frequency regime above 10 d-1 and to unravel rotational splitting of several of the pulsation modes, and hence would open stellar modelling applications from the mode identification of the multiplet structures.
Acknowledgments
A.T., P.D., and C.A. are grateful to the staff of the Kavli Institute of Theoretical Physics (KITP) of the University of California at Santa Barbara (UCSB) for the hospitality during their stay in the framework of the 2011 Research Programme “Asteroseismology in the Space Age”. T.M. acknowledges financial support from Belspo for contract PRODEX GAIA-DPAC. The research leading to these results has received funding from the European Research Council under the European Community Seventh Framework Programme (FP7/2007−2013)/ERC grant agreement N°227224 (PROSPERITY), from the Belgian Science Policy Office (Belspo) under PRODEX contract C90309: CoRoT Data Exploitation, and from the National Science Foundation of the United States under grant N°NSF PHY05–51164, and from the FNRS. The CoRoT space mission was developed and is operated by the French space agency CNES, with participation of ESAs RSSD and Science Programmes, Austria, Belgium, Brazil, Germany, and Spain. Based on observations made with the HERMES spectrograph, installed at the Mercator Telescope, operated on the island of La Palma by the Flemish Community, at the Spanish Observatorio del Roque de los Muchachos of the Instituto de Astrofísica de Canarias and supported by the Fund for Scientific Research of Flanders (FWO), Belgium, the Research Council of K.U. Leuven, Belgium, the Fonds National de la Recherche Scientific (F.R.S.–FNRS), Belgium, the Royal Observatory of Belgium, the Observatoire de Genève, Switzerland, and the Thüringer Landessternwarte Tautenburg, Germany.
References
- Aerts, C., & Dupret, M.-A. 2012, in Progress in Solar/Stellar Physics with Helio- and Asteroseismology, eds. H. Shibahashi, M. Takata, & A. E. Lynas-Gray, ASP Conf. Ser., 462, 103 [Google Scholar]
- Aerts, C., De Cat, P., Peeters, E., et al. 1999, A&A, 343, 872 [NASA ADS] [Google Scholar]
- Aerts, C., Lehmann, H., Briquet, M., et al. 2003a, A&A, 399, 639 [NASA ADS] [CrossRef] [EDP Sciences] [Google Scholar]
- Aerts, C., Thoul, A., Daszyńska, J., et al. 2003b, Science, 300, 1926 [NASA ADS] [CrossRef] [PubMed] [Google Scholar]
- Aerts, C., De Cat, P., Handler, G., et al. 2004a, MNRAS, 347, 463 [NASA ADS] [CrossRef] [Google Scholar]
- Aerts, C., Waelkens, C., Daszyńska-Daszkiewicz, J., et al. 2004b, A&A, 415, 241 [NASA ADS] [CrossRef] [EDP Sciences] [Google Scholar]
- Aerts, C., De Cat, P., Kuschnig, R., et al. 2006a, ApJ, 642, L165 [NASA ADS] [CrossRef] [Google Scholar]
- Aerts, C., Marchenko, S. V., Matthews, J. M., et al. 2006b, ApJ, 642, 470 [NASA ADS] [CrossRef] [Google Scholar]
- Aerts, C., Christensen-Dalsgaard, J., & Kurtz, D. W. 2010, Asteroseismology (Springer) [Google Scholar]
- Aerts, C., Briquet, M., Degroote, P., Thoul, A., & van Hoolst, T. 2011, A&A, 534, A98 [NASA ADS] [CrossRef] [EDP Sciences] [Google Scholar]
- Asplund, M., Grevesse, N., Sauval, A. J., & Scott, P. 2009, ARA&A, 47, 481 [NASA ADS] [CrossRef] [Google Scholar]
- Ausseloos, M., Scuflaire, R., Thoul, A., & Aerts, C. 2004, MNRAS, 355, 352 [NASA ADS] [CrossRef] [Google Scholar]
- Auvergne, M., Bodin, P., Boisnard, L., et al. 2009, A&A, 506, 411 [NASA ADS] [CrossRef] [EDP Sciences] [Google Scholar]
- Ballot, J., Lignières, F., Reese, D. R., & Rieutord, M. 2010, A&A, 518, A30 [NASA ADS] [CrossRef] [EDP Sciences] [Google Scholar]
- Ballot, J., Lignières, F., Prat, V., Reese, D. R., & Rieutord, M. 2012, in Progress in Solar/Stellar Physics with Helio- and Asteroseismology, eds. H. Shibahashi, M. Takata, & A. E. Lynas-Gray, ASP Conf. Ser., 462, 389 [Google Scholar]
- Balona, L. A., Pigulski, A., Cat, P. D., et al. 2011, MNRAS, 413, 2403 [NASA ADS] [CrossRef] [Google Scholar]
- Blackwell, D. E., Shallis, M. J., & Selby, M. J. 1979, MNRAS, 188, 847 [NASA ADS] [CrossRef] [Google Scholar]
- Briquet, M., Lefever, K., Uytterhoeven, K., & Aerts, C. 2005, MNRAS, 362, 619 [NASA ADS] [CrossRef] [Google Scholar]
- Briquet, M., Morel, T., Thoul, A., et al. 2007, MNRAS, 381, 1482 [NASA ADS] [CrossRef] [Google Scholar]
- Briquet, M., Uytterhoeven, K., Morel, T., et al. 2009, A&A, 506, 269 [NASA ADS] [CrossRef] [EDP Sciences] [Google Scholar]
- Butler, K., & Giddings, J. R. 1985, in Newsletter of Analysis of Astronomical Spectra, issue 9 (Dpt Physics & Astronomy, University College) [Google Scholar]
- Cameron, C., Saio, H., Kuschnig, R., et al. 2008, ApJ, 685, 489 [NASA ADS] [CrossRef] [Google Scholar]
- Castelli, F., & Kurucz, R. L. 2003, in Modelling of Stellar Atmospheres, eds. N. Piskunov, W. W. Weiss, & D. F. Gray, IAU Symp., 210, 20 [Google Scholar]
- Christensen-Dalsgaard, J. 2002, Rev. Mod. Phys., 74, 1073 [NASA ADS] [CrossRef] [Google Scholar]
- Claret, A. 1995, A&AS, 109, 441 [NASA ADS] [Google Scholar]
- Cutri, R. M., Skrutskie, M. F., van Dyk, S., et al. 2003, 2MASS All Sky Catalog of point sources (NASA/IPAC Infrared Science Archive) [Google Scholar]
- Cutri, R. M., Wright, E. L., Conrow, T., et al. 2011, Explanatory Supplement to the WISE Preliminary Data Release Products, Tech. Rep. [Google Scholar]
- De Ridder, J., Telting, J. H., Balona, L. A., et al. 2004, MNRAS, 351, 324 [NASA ADS] [CrossRef] [Google Scholar]
- Degroote, P., Briquet, M., Catala, C., et al. 2009, A&A, 506, 111 [NASA ADS] [CrossRef] [EDP Sciences] [Google Scholar]
- Degroote, P., Aerts, C., Baglin, A., et al. 2010, Nature, 464, 259 [NASA ADS] [CrossRef] [PubMed] [Google Scholar]
- Degroote, P., Acke, B., Samadi, R., et al. 2011, A&A, 536, A82 [NASA ADS] [CrossRef] [EDP Sciences] [Google Scholar]
- Desmet, M., Briquet, M., Thoul, A., et al. 2009, MNRAS, 396, 1460 [NASA ADS] [CrossRef] [MathSciNet] [Google Scholar]
- Diago, P. D., Gutiérrez-Soto, J., Auvergne, M., et al. 2009, A&A, 506, 125 [NASA ADS] [CrossRef] [EDP Sciences] [Google Scholar]
- Dupret, M.-A., Thoul, A., Scuflaire, R., et al. 2004, A&A, 415, 251 [NASA ADS] [CrossRef] [EDP Sciences] [Google Scholar]
- Dziembowski, W. A., & Pamyatnykh, A. A. 2008, MNRAS, 385, 2061 [NASA ADS] [CrossRef] [Google Scholar]
- Giddings, J. R. 1981, Ph.D. Thesis, University of London [Google Scholar]
- Grevesse, N., & Sauval, A. J. 1998, Space Sci. Rev., 85, 161 [NASA ADS] [CrossRef] [Google Scholar]
- Gutiérrez-Soto, J., Floquet, M., Samadi, R., et al. 2009, A&A, 506, 133 [NASA ADS] [CrossRef] [EDP Sciences] [Google Scholar]
- Handler, G., Shobbrook, R. R., Jerzykiewicz, M., et al. 2004, MNRAS, 347, 454 [NASA ADS] [CrossRef] [Google Scholar]
- Handler, G., Shobbrook, R. R., & Mokgwetsi, T. 2005, MNRAS, 362, 612 [NASA ADS] [CrossRef] [Google Scholar]
- Handler, G., Jerzykiewicz, M., Rodríguez, E., et al. 2006, MNRAS, 365, 327 [NASA ADS] [CrossRef] [Google Scholar]
- Høg, E., Fabricius, C., Makarov, V. V., et al. 2000, A&A, 355, L27 [NASA ADS] [Google Scholar]
- Huat, A.-L., Hubert, A.-M., Baudin, F., et al. 2009, A&A, 506, 95 [NASA ADS] [CrossRef] [EDP Sciences] [Google Scholar]
- Ishihara, D., Onaka, T., Kataza, H., et al. 2010, A&A, 514, A1 [NASA ADS] [CrossRef] [EDP Sciences] [Google Scholar]
- Jerzykiewicz, M., Handler, G., Shobbrook, R. R., et al. 2005, MNRAS, 360, 619 [NASA ADS] [CrossRef] [Google Scholar]
- Koen, C., & Eyer, L. 2002, MNRAS, 331, 45 [NASA ADS] [CrossRef] [Google Scholar]
- Lanz, T., & Hubeny, I. 2007, ApJS, 169, 83 [CrossRef] [Google Scholar]
- Lenz, P., & Breger, M. 2005, Comm. Asteroseismol., 146, 53 [Google Scholar]
- Lyubimkov, L. S., Rachkovskaya, T. M., Rostopchin, S. I., & Lambert, D. L. 2002, MNRAS, 333, 9 [NASA ADS] [CrossRef] [Google Scholar]
- Mermilliod, J. C. 1986, Bulletin d’Information du Centre de Données Stellaires, 31, 185 [Google Scholar]
- Mermilliod, J., Mermilliod, M., & Hauck, B. 1997, A&AS, 124, 349 [NASA ADS] [CrossRef] [EDP Sciences] [Google Scholar]
- Michel, E., Baglin, A., Auvergne, M., et al. 2006, in ESA SP 1306, eds. M. Fridlund, A. Baglin, J. Lochard, & L. Conroy, 39 [Google Scholar]
- Morel, T., & Butler, K. 2008, A&A, 487, 307 [NASA ADS] [CrossRef] [EDP Sciences] [Google Scholar]
- Morel, T., Butler, K., Aerts, C., Neiner, C., & Briquet, M. 2006, A&A, 457, 651 [NASA ADS] [CrossRef] [EDP Sciences] [Google Scholar]
- Morel, T., Hubrig, S., & Briquet, M. 2008, A&A, 481, 453 [NASA ADS] [CrossRef] [EDP Sciences] [Google Scholar]
- Neiner, C., Gutiérrez-Soto, J., Baudin, F., et al. 2009, A&A, 506, 143 [NASA ADS] [CrossRef] [EDP Sciences] [Google Scholar]
- Ofek, E. O. 2008, PASP, 120, 1128 [NASA ADS] [CrossRef] [Google Scholar]
- Pamyatnykh, A. A. 1999, Acta Astron., 49, 119 [Google Scholar]
- Pamyatnykh, A. A., Handler, G., & Dziembowski, W. A. 2004, MNRAS, 350, 1022 [NASA ADS] [CrossRef] [Google Scholar]
- Pápics, P. I., Briquet, M., Auvergne, M., et al. 2011, A&A, 528, A123 [NASA ADS] [CrossRef] [EDP Sciences] [Google Scholar]
- Pápics, P. I., Briquet, M., Baglin, A., et al. 2012, A&A, 542, A55 [NASA ADS] [CrossRef] [EDP Sciences] [Google Scholar]
- Raskin, G., van Winckel, H., Hensberge, H., et al. 2011, A&A, 526, A69 [NASA ADS] [CrossRef] [EDP Sciences] [Google Scholar]
- Rufener, F. 1988, Catalogue of stars measured in the Geneva Observatory photometric system, 4, 1988 [Google Scholar]
- Rufener, F., & Nicolet, B. 1988, A&A, 206, 357 [NASA ADS] [Google Scholar]
- Saio, H., Cameron, C., Kuschnig, R., et al. 2007, ApJ, 654, 544 [NASA ADS] [CrossRef] [Google Scholar]
- Scuflaire, R., Théado, S., Montalbán, J., et al. 2008, Ap&SS, 316, 83 [NASA ADS] [CrossRef] [Google Scholar]
- Simón-Díaz, S. 2010, A&A, 510, A22 [NASA ADS] [CrossRef] [EDP Sciences] [Google Scholar]
- Simón-Díaz, S., & Herrero, A. 2007, A&A, 468, 1063 [NASA ADS] [CrossRef] [EDP Sciences] [Google Scholar]
- Thompson, G. I., Nandy, K., Jamar, C., et al. 1978, Catalogue of stellar ultraviolet fluxes. A compilation of absolute stellar fluxes measured by the Sky Survey Telescope (S2/68) aboard the ESRO satellite TD-1 (NASA/STI) [Google Scholar]
- Wesselius, P. R., van Duinen, R. J., Aalders, J. W. G., & Kester, D. 1980, A&A, 85, 221 [NASA ADS] [Google Scholar]
- Wesselius, P. R., van Duinen, R. J., de Jonge, A. R. W., et al. 1982, A&AS, 49, 427 [NASA ADS] [Google Scholar]
- Wright, E. L., Eisenhardt, P. R. M., Mainzer, A. K., et al. 2010, AJ, 140, 1868 [NASA ADS] [CrossRef] [Google Scholar]
All Tables
All Figures
|
Fig. 1 CoRoT light curve of HD 49877, with an inset to show the short-time behaviour. The bottom panel represents the residuals after prewhitening with a model based on the 55 frequencies listed in Table 1. |
| In the text | |
|
Fig. 2 Fourier transform of the light curve. |
| In the text | |
|
Fig. 3 Phase plot of the rotational signal, where all signals not related to the rotational frequency and its harmonics have been filtered out. |
| In the text | |
|
Fig. 4 Excerpt of the high-resolution high signal-to-noise spectrum (black) of HD 48977, obtained with the HERMES spectrograph attached to the Mercator Telescope. Grey lines indicate the zero-rotation line depths of a template spectrum with Teff = 20 000 K and log g = 4.2 dex (solar mixture and solar metallicity). |
| In the text | |
|
Fig. 5 Theoretical EW ratios for log g = 4.2 of the suitable Si II and Si III lines in the spectrum with proper atomic data. Theoretical values are plotted for two values of the microturbulence, ξ = 1 km s-1 (full lines) and ξ = 5 km s-1 (dashed lines), and four values of the Si abundance, log ϵ(Si) = 7.54, 7.34, 7.14, 6.94 dex. The two horizontal lines represent the observed values with their error bar. |
| In the text | |
|
Fig. 6 Instability strips for B stars, as well as observed SPB stars from ground-based surveys (dots) taken from Pamyatnykh (1999). The position of HD 48977 is indicated as a square. |
| In the text | |
|
Fig. 7 Observed and model photometric colours of HD 48977. Crosses denote the synthetic flux of the best fitting model, circles denote the observations and their errors. Filled circles are included in the fit as colors (optical and UV), open circles are included as absolute photometry (infrared). |
| In the text | |
Current usage metrics show cumulative count of Article Views (full-text article views including HTML views, PDF and ePub downloads, according to the available data) and Abstracts Views on Vision4Press platform.
Data correspond to usage on the plateform after 2015. The current usage metrics is available 48-96 hours after online publication and is updated daily on week days.
Initial download of the metrics may take a while.