| Issue |
A&A
Volume 550, February 2013
|
|
|---|---|---|
| Article Number | A68 | |
| Number of page(s) | 10 | |
| Section | Extragalactic astronomy | |
| DOI | https://doi.org/10.1051/0004-6361/201220783 | |
| Published online | 29 January 2013 | |
Deep, wide-field, global VLBI observations of the Hubble deep field north (HDF-N) and flanking fields (HFF)
1 Kapteyn Astronomical Institute, University of Groningen, PO Box 800, 9700 AV Groningen, The Netherlands
e-mail: This email address is being protected from spambots. You need JavaScript enabled to view it.
2 Joint Institute for VLBI in Europe (JIVE), PO Box 2, 7990 AA Dwingeloo, The Netherlands
3 Netherlands Foundation for Research in Astronomy (ASTRON), PO Box 2, 7990 AA Dwingeloo, The Netherlands
4 Centre for Astrophysics and Supercomputing, Swinburne University of Technology, Mail number H39, PO Box 218, Hawthorn, Victoria 3122, Australia
5 Leiden Observatory, PO Box 9513, 2300 RA Leiden, The Netherlands
Received: 23 November 2012
Accepted: 21 December 2012
Abstract
Context. Dust is commonly present in weakly radio emitting star-forming galaxies and this dust may obscure the signatures of accreting black holes in these objects.
Aims. We aim to uncover weak active galactic nuclei, AGN, in the faint radio source population by means of deep high-resolution radio observations.
Methods. VLBI observations with a world-wide array at unparallelled sensitivity are carried out to assess the nature of the faint radio source population in the Hubble deep field north and its flanking fields.
Results. Images of twelve compact, AGN-driven radio sources are presented. These represent roughly one quarter of the detectable faint radio source sample. Most, but not all of these low power AGN have X-ray detections.
Conclusions. The majority of the faint radio source population must be star-forming galaxies. Faint AGN occur in a variety of (distant) host galaxies, and these are often accompanied by a dust-obscured starburst. Deep, high-resolution VLBI is a unique, powerful technique to assess the occurrence of faint AGN.
Key words: galaxies: active / radio continuum: galaxies / galaxies: starburst
Deceased.
© ESO, 2013
1. Introduction
Deep wide-field radio observations of the Hubble deep field north (HDF-N) and surrounding flanking fields (HFFs) have revealed a population of sub-mJy and microJy radio sources, of which a substantial fraction are associated with relatively distant star-forming galaxies (Richards et al. 1998; Garrett et al. 2001; Muxlow et al. 2005). Optical studies of these fields indicate that a significant fraction of the hosts of these radio sources are faint, remaining undetected in deep Hubble Space Telescope I-band imaging (Richards et al. 1999). Some of these objects can be seen in the near-IR and have very red colors, leading to their interpretation as distant, dust-enshrouded starbursts (Dickinson et al. 2000).
While X-ray and follow-up surveys have established a substantial surface density of active galactic nuclei (AGN) among these and other distant galaxies (e.g. Alexander et al. 2003; Bauer et al. 2004; Xue et al. 2011), the actual AGN surface (and space) density is most likely higher. Many models for the growth of supermassive black holes predict that the most rapid growth phase will be obscured by Compton-thick absorption (Fabian 1999; Hopkins et al. 2006), which is for instance supported by mid-infrared observations of Type-2 quasi-stellar objects (QSOs) (Martínez-Sansigre et al. 2005). The importance of strongly obscured AGN became apparent from studies of radio-excess (with respect to infrared) AGN without X-ray counterparts (Donley et al. 2005), and from the X-ray properties of seemingly normal or optically obscured star-forming galaxies displaying excess infrared emission (Daddi et al. 2007; Fiore et al. 2009; Murphy et al. 2009; Pope et al. 2008; Georgakakis et al. 2010; Luo et al. 2011; Alexander et al. 2011). Infrared and submm photometric surveys have proven extremely valuable. The former permit AGN identification on the basis of the shape of the infrared spectral energy distribution (SED; e.g. Alonso-Herrero et al. 2006; Donley et al. 2007), or using infrared color − color selection (e.g. Stern et al. 2005; Lacy et al. 2004; Donley et al. 2012). The latter survey technique finds distant starburst galaxies with an occasional embedded AGN (e.g. Pope et al. 2006; Lutz et al. 2010; Biggs et al. 2010). The general reliability of these selection techniques, and the level of AGN completeness nevertheless remain debatable.
Access to the complete infrared-submm spectral energy distributions, SEDs, has recently become possible through Herschel Space Observatory data, and the SED data permit separation of AGN- and starburst-heating in a consistent fashion. On the basis of extensive Herschel observations, redshift evolution of star-formation in a large sample of X-ray selected AGN hosts was explained by Mullaney et al. (2012) as being due to evolution of the specific star-formation rate (sSFR) in otherwise normal star-forming host galaxies. Employing multi-wavelength SED decomposition, a frequent occurrence of excess radio emission attributed to weak AGN in distant star-forming galaxies was very recently established by Del Moro et al. (2013).
One of the key questions in extragalactic astronomy is the true incidence of AGN in distant starburst galaxies and the symbiotic interaction of the two phenomena (e.g. Silk 2005; Schweitzer et al. 2006). All abovementioned studies make it very clear that the phenomena of star-formation and accretion-driven nuclear activity can occur in concert. It is however also very clear that dust obscuration plays an important role, preventing full and complete assessment of the occurrence of AGN among mildly or strongly star-forming galaxies using ultraviolet, optical, infrared and even X-ray observations.
Dust obscuration does not affect the radio band, hence cm-wavelength radio emission at arcsec scale resolution can be used to find (weak) AGN among star-forming galaxies1. The radio-infrared ratio can be used to isolate radio-excess objects among the faint radio source population, just on itself (e.g. Donley et al. 2005), or in combination with radio morphology and spectral shape (Seymour et al. 2008). Considering the nature of the faint radio source population, the power of subarcsec radio imaging was shown by Muxlow et al. (2005), and in the case of distant infrared galaxies by Casey et al. (2009). The present study follows up on the work of Muxlow et al. (2005), employing Very Long Baseline Interferometry, VLBI, to obtain 1 − 10 milliarcsec scale resolution on the 92 faint radio sources reported by these authors in the HDF-N and its flanking fields. Only such deep VLBI observations are capable of distinguishing between radio emission generated by star-formation processes and AGN activity in distant dust-obscured systems.
Previous VLBI observations of the HDF-N, carried out with the European VLBI Network, EVN (Garrett et al. 2001) already demonstrated the power of deep, high resolution VLBI imaging in discriminating between starburst and AGN activity in dust obscured systems, yielding important morphological information as well as brightness temperatures. This paper presents the culmination of that study, employing a global array of VLBI telescopes attaining milliarcsec-scale resolution and micro-Jansky sensitivity over a considerably larger field.
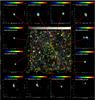 |
Fig. 1 Composite image of the radio (WSRT 1.4 GHz) – optical overlay image of the HDF-N and HFF, surrounded by postage stamp images of the twelve compact VLBI-detected radio sources. The cyan circles represent annuli of decreasing resolution and sensitivity, and are drawn at 2, 4, 6, and 8 arcmin radius w.r.t. the phase center which coincides with radio AGN VLA J123642+621331 (see text Sect. 3). |
2. Global VLBI observations and data analysis
Observations of the HDF-N and HFF region were made with a global VLBI array on 20 − 22 February 2004 at 1.4 GHz. A total of 36 h observing time was split into three 12 h runs. The global VLBI array consisted of 16 telescopes in Europe and the USA, including the 100-m Effelsberg, 100-m Green Bank, and 76-m Lovell (Jodrell Bank) telescopes, recording data at a bit rate of 128 Mbits/s (2 × 8 MHz bands) in both right (R)- and left (L)-hand circular polarisation. The observations were made in phase-referencing mode with a typical cycle time of 160 s on the secondary phase-calibrator and 330 s on the HDF-N. The total on-source integration time on the HDF-N was ~19 h. Two phase-calibrators were used: a strong primary calibrator J1241+602 (a compact S1.4 GHz ~ 455 mJy source lying 2° from the HDF-N) and a fainter secondary calibrator J1234+619 (S1.4 GHz ~ 20 mJy lying only 20′ from the HDF-N). The primary calibrator was typically observed for 100 s once every ~42 min; more frequent scans on the nearby, secondary calibrator permitted to make the finer phase corrections.
The data were processed at the European VLBI Network (EVN) correlator at the Joint Institute for VLBI in Europe, JIVE, in Dwingeloo, the Netherlands. Each 8 MHz band (R&L) was correlated in separate passes in order to maximise spectral resolution (256 channels/IF) thereby minimizing bandwidth smearing. The total data set was 675 Gbytes in size making this one of the largest and most complex VLBI data sets ever processed. An integration time of 0.25 s was employed to reduce the effects of time smearing. The phase center was coincident with a 470 μJy radio source, VLA J123642+621331 (Richards 2000), located just outside the HDF-N (in an adjacent HFF; see Sect. 3.1.1). The data from each IF were averaged, edited, and calibrated with the NRAO AIPS package, and gain parameters were subsequently applied to the unaveraged original data. The visibility amplitudes were calibrated using the system temperatures and gain information provided by each telescope.
In order to image out the entire HDF-N and HFF, the wide-field imaging technique was used (Garrett et al. 1999). A large number (92 – see below) of dirty images and dirty beams for each 8 MHz band (R&L simultaneously) were generated using IMAGR, and co-added; fields with a clear detection were subsequently CLEANed using APCLN. The absolute flux density scales of the VLBI observations are expected to be better than 5%. However, we note that the VLBI flux densities have not been corrected for primary beam attenuation. The calibrators used have positions that are measured to better than one milliarcsec. We therefore estimate the uncertainties in VLBI positions to be set by errors introduced by the ionosphere. With a separation of 0.5 degrees between our main phase reference source and the target fields, we estimate an error of ~1−2 milliarcsec in each coordinate.
3. Global VLBI detections in the HDF-N and HFF region
The wide-field global VLBI survey covered a total of 201 arcmin2 divided into four annular fields with different sensitivities and angular resolutions. The observations are both deeper and wider than any previous VLBI observations of the field, attaining an rms noise level of 7.3 μJy/beam with 4 mas (milli-arcsec) angular resolution in the central 0 − 2′ part. The outer annuli, at 2′−4′, 4′−6′, and 6′−8′ from the phase center, have 14−37 μJy/beam rms noise level and 19−27 mas angular resolution. Radio images were made for all of the 92 radio sources which were detected by the MERLIN-VLA survey (Muxlow et al. 2005) in these areas. These 92 sources had been classified on the basis of their arcsec-scale radio morphologies combined with their infrared flux densities, as follows: 18 AGN or AGN candidates, 3 starbursts with embedded AGN, 45 starbursts or starburst candidates, and 26 unclassified radio sources (Muxlow et al. 2005). Taking the variable VLBI sensitivity over the whole field into account, 48 out of these 92 radio sources are bright enough to be detected by our observations. However, VLBI detection critically depends on the angular dimension of the radio component(s): extended arcsec-scale emission will be completely resolved by the small VLBI beam.
Our new global VLBI observations clearly reveal 12 compact radio sources in the HDF-N and HFF above the local 5σ detection level. This corresponds to a ~25% detection rate. Figure 1 presents the radio-optical overlay of the fields, combining the arcsec and milliarcsec radio imaging. The global VLBI detections are listed in Table 1, with the MERLIN-VLA radio structure description and object classification in Cols. 10 and 11. The radio structural description is as follows: C: compact, at 0.2 arcsec resolution; CE: compact with 2-sided extended emission; C1E: compact with 1-sided extended emission; FR1: Fanaroff and Riley Class 1 edge-darkened double-lobed radio galaxy. The table also contains q24-values, defined as the logarithm of the 24 μm/1.4 GHz flux density ratio (where the integrated arcsec scale radio emission as measured with the Very Large Array (VLA) was used in the computation). Among the VLBI sources, three (VLA J123642+621331, VLA J123644+621133, and VLA J123646+621404) had been detected in earlier EVN 1.6 GHz observations (Garrett et al. 2001), but the other nine radio sources are new. All detected objects are described separately, in two subsections below.
3.1. Inner HDF-N and adjacent HFF
3.1.1. VLA J123642+621331
VLA J123642+621331 lies just outside the HDF-N, in an adjacent HFF. It has a steep radio spectrum (α = 0.94, Sν ∝ ν−α); its optical counterpart has I = 25 (Richards et al. 1998; Muxlow et al. 2005). HST NICMOS 1.1 μm (F110W), 1.6 μm (F160W), and KPNO 4-m K-band imaging detect a red host (I814 − K = 2.0 ± 0.2) for the radio source, and spectra obtained by the Keck II telescope show a single strong Lyα emission line at z = 4.424 (Waddington et al. 1999; Dickinson 1998). This source is also detected in the ISO 15 μm and Chandra soft X-ray bands (Aussel et al. 1999; Brandt et al. 2001). Waddington et al. (1999) interpret the object as a dust-obscured starburst with an embedded AGN.
The deep MERLIN-VLA observations at 1.4 GHz (Muxlow et al. 2005) resolved VLA J123642+621331, showing extended emission adjacent to an unresolved core, which corresponds to the core detected by the EVN 1.6 GHz observations (Garrett et al. 2001). The ratio of its radio and far-infrared (FIR) luminosity indicates that the object has a modest radio excess (Garrett 2002), providing further evidence for an embedded AGN: its q24-value is − 0.35.
The deep, high-resolution global VLBI image removes all doubts, revealing a jet-like extension (~120 μJy) emanating from a compact AGN core. The integrated flux density is in agreement with the Garrett et al. (2001) measurement. The separation between the jet and the AGN core is about 70 pc. This may be an example of a high redshift ultra luminous infrared galaxy in which the high star-formation rate and the efficiency are enhanced by AGN jet activity (e.g. Silk 2005).
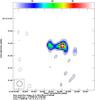 |
Fig. 2 VLA J123642+621331. In this and subsequent radio images, the clean beam FWHM is specified in the bottom left corner. Contours are plotted starting at 3σ and the relevant noise figure can be found below each image. The color coding is specified above each image. |
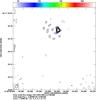 |
Fig. 3 VLA J123644+621133. |
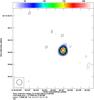 |
Fig. 4 VLA J123646+621404. |
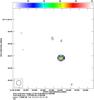 |
Fig. 5 VLA J123652+621444. |
3.1.2. VLA J123644+621133
VLA J123644+621133 is optically identified with an I = 20.9, very red elliptical galaxy at z = 1.050 (Cohen et al. 2000). Its large-scale radio structure and luminosity indicate a classical FR-I radio galaxy (Richards et al. 1998; Muxlow et al. 2005). The AGN nature also follows from its negative q24 upper limit. The previous EVN 1.6 GHz observations (Garrett et al. 2001) revealed a compact core component and an additional 5σ component located ~60 mas south of the core component, of which the direction coincides with the extension of the VLA-only (Richards et al. 1998) and MERLIN-VLA radio morphology (Muxlow et al. 2005). The Westerbork Synthesis Radio Telescope (WSRT) and more recent (Morrison et al. 2010) VLA flux densities indicate substantial resolution effects. Our high resolution VLBI observations merely detect the core.
3.1.3. VLA J123646+621404
VLA J123646+621404 has a slightly inverted radio spectrum (α = −0.04) and is associated with a nearly face-on spiral galaxy (I = 20.7), at a redshift of 0.961 (Cowie et al. 2004). The MERLIN-VLA image shows a compact component and two-sided extended emission, and EVN 1.6 GHz observations detect a 4σ radio source at this position (Garrett et al. 2001; Muxlow et al. 2005). Its radio variability is evident from Richards et al. (1998), from the present data, and from recent VLA data (Morrison et al. 2010). Those VLA data in fact imply q24 = −0.18. Taken together with the broad emission line character (Phillips et al. 1997; Brandt et al. 2001), there is no doubt about the presence of an AGN.
3.1.4. VLA J123652+621444
VLA J123652+621444 is an inverted spectrum radio source (α = −0.12) located in an adjacent HFF and observed to vary in intensity on the timescale of months, suggesting the presence of an AGN (Richards et al. 1998; Richards 2000; Morrison et al. 2010). The object displays radio excess, as judged from its q24-value. MERLIN-VLA observations reveal a compact core, which overlies the nucleus of an I = 18.5 elliptical galaxy at z = 0.321, and a one-sided jet-like feature to the east (Cowie et al. 2004; Muxlow et al. 2005). The high resolution VLBI observations merely detect the 0.08 mJy radio core.
3.2. Outer HFF region
3.2.1. VLA J123608+621035
VLA J123608+621035 is a relatively flat-spectrum radio source (α = 0.36) hosted by an I = 20.6 galaxy at z = 0.681 (Richards 2000; Cowie et al. 2004). The object is bright in the infrared, and falls on the radio-FIR correlation. Its compact radio core is straddled by two-sided radio emission extending over ≲ 1″ (Muxlow et al. 2005); our VLBI detects a slightly extended 0.140 mJy radio core.
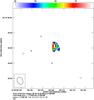 |
Fig. 6 VLA J123608+621035. |
3.2.2. VLA J123623+621642
VLA J123623+621642 has a steep radio spectrum (α = 0.63) and its MERLIN-VLA image shows a compact component with weak extended (sub-arcsec) emission (Richards 2000; Muxlow et al. 2005). The radio source is identified with an I = 23.9 galaxy at z = 1.918; its radio and infrared data indicate a radio-excess. As inferred from the VLBI observations, a substantial fraction of the radio luminosity is contained within its milliarcsec-scale radio core.
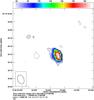 |
Fig. 7 VLA J123623+621642. |
3.2.3. VLA J123642+621545
VLA J123642+621545 is an intermediate radio spectrum source (α = 0.50), associated with an I = 20.7 galaxy at a redshift of 0.857 (Richards 2000; Hornschemeier et al. 2001). The source was also detected by ISO and Chandra. Muxlow et al. (2005) suggest that the compact component could be an AGN, but Hornschemeier et al. (2001) interpreted the X-ray’s as originating from a starburst system. The VLBI observations uncover a compact component of variable flux density in this infrared-luminous object. The object falls on the radio-infrared correlation using the low-state VLA flux density, but definitely also contains an AGN.
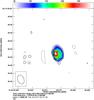 |
Fig. 8 VLA J123642+621545. |
3.2.4. VLA J123700+620909
VLA J123700+620909 represents similar properties to VLA J123642+621331. It has relatively strong radio emission and a steep radio spectrum (α = 0.89). There is no optical counterpart to R = 27 (Richards et al. 1998). The MERLIN-VLA observations detected the source, finding a compact radio component and one-sided emission to the north-east. At the same time, deep Spitzer IRAC and MIPS imaging as well as SCUBA 850 μm observations (Pope et al. 2006) also detected this source, GN 16. Given its ERO-character as well as the results of the multi-wavelength studies in sub-mm, IR, and radio, this source is considered to be a starburst galaxy (SFR ~ 1000 M⊙/yr), at zphotom. = 1.68 (Pope et al. 2005, 2006). The VLBI observations find a ~ 0.15 mJy compact radio core in this mild radio-excess, q24 = −0.08 object.
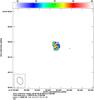 |
Fig. 9 VLA J123700+620909, GN16. |
3.2.5. VLA J123714+620823
VLA J123714+620823 is associated with a faint, R = 24.25 (Capak et al. 2004) red object. Cowie (2010, priv. comm.) provided a tentative redshift z = 0.847. With a total 1.4 GHz flux density of well over a mJy, the object has a moderate radio excess, as noted also by Donley et al. (2005). The VLBI radio source is somewhat extended, and the WSRT and VLA measurements indicate extended emission on the arcsec and subarcsec scale. The 21 μJy 8.4 GHz VLA source J123714+620822 (Richards et al. 1998) is 0.3 arcsec away and its relation to J123714+620823 is unclear.
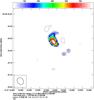 |
Fig. 10 VLA J123714+620823. |
3.2.6. VLA J123716+621512
VLA J123716+621512 has a relatively flat radio spectrum (α = 0.41) (Richards 2000). The radio structure consists of a compact component and one-sided emission extending ~0.4 arcsec to the south-west (Muxlow et al. 2005); the radio structure is hosted by an I = 19.8 galaxy at z = 0.561 (Cowie 2012, priv. comm.). The VLBI observations detect a ~0.1 mJy compact radio core in this q24 = −0.06 object. Recent VLA observations (Morrison et al. 2010) indicate radio variability.
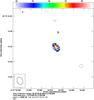 |
Fig. 11 VLA J123716+621512. |
3.2.7. VLA J123716+621733
VLA J123716+621733 is a 0.35 mJy radio source with an I = 22.2 optical counterpart at a redshift of 1.146 (Cowie et al. 2004). The MERLIN-VLA survey detected this radio source, finding a compact component with a ~0.6 arcsec one-sided extension to the south-west (Muxlow et al. 2005). The infrared-bright object was also detected in the deep Chandra survey, in both the hard and soft bands. Our VLBI detects a compact core containing about half of the VLA flux density.
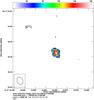 |
Fig. 12 VLA J123716+621733. |
3.2.8. VLA J123721+621129
VLA J123721+621129 has no optical counterpart to I = 25 and shows an inverted radio spectrum (α = −0.28) with a dominant compact radio component and one-sided emission to the north (Muxlow et al. 2005). Using deep imaging data from Barger et al. (1999), Richards et al. (1999) report that this radio source is associated with a very red object having I − K > 5.2. Barger et al. (2008) list z = 1.604. The compact radio component is slightly extended at ~25 mas resolution, and must be responsible for most if not all of the radio emission in this moderate radio-excess (q24 = −0.26) object.
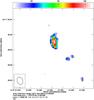 |
Fig. 13 VLA J123721+621129. |
4. Discussion
This research has once more demonstrated the unique strength of high resolution radio astronomy in assessing the properties, i.e., mechanisms-at-work in the distant galaxy population. Our VLBI study builds upon the VLA+MERLIN studies of Muxlow et al. (2005), confirming, updating, and refining the results of that study. Being sensitive to compact radio emission having brightness temperatures in excess of 105 K, the VLBI observations unambiguously nail down AGN-related emission. Combining radio-spectral data with radio morphological and 15 μ infrared information, Muxlow et al. (2005) classified 18 out of their sample of 92 faint radio sources as AGN or AGN-candidate (AGNC). Their starburst and starburst-candidate class contains 48 objects. 28% of the sample, that is 26 objects, remain unclassified. It is furthermore very interesting to note that more than half of the total n = 92 sample have Chandra X-ray counterparts, occurring both in the starburst and in the AGN class. With reference to the subfinal column of Table 1, our VLBI merely detects objects from the VLA+MERLIN AGN and AGNC classes, and not a single starburst object. Table 2 summarizes the VLBI update with respect to the AGN and AGNC classes of Muxlow et al. (2005), and adds the new AGN.
Summary: compact radio sources in HDF-N and HFF.
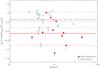 |
Fig. 14 Values of q24 for SBs (black empty squares) and 11 global VLBI detections (red filled squares), as function of redshift. The thick dashed (black) and solid (red) lines represent the mean values for each sample, respectively, and the 1σ deviation is shown by thinner black dashed and red lines. |
VLBI detected and undetected AGN and AGN candidates from the VLA+MERLIN 1.4 GHz survey (Muxlow et al. 2005).
Of the 18 AGN and candidate AGN we confirm six AGN (J123608+621035, J123644+621133, J123646+621404, J123652+621444, J123714+620823, J123721+6211295), we nail down the AGN in four AGNC including the submm source GN16 (J123623+621642, J123700+620909/ GN16, J123716+621512, J123716+621733) and in the z = 4.424 starburst system with embedded AGN J123642+621331. In addition we demonstrate the presence of an AGN in the z = 0.857 object J123642+621545. It is seen that the VLBI misses out on seven faint (<150 μJy) AGN/AGNC and on the relatively bright (5 mJy) wide-angle-tail radio galaxy J123725+621128, for the obvious reasons of sensitivity combined with resolution of extended low surface brightness emission. Relevant (total) 1.4 GHz radio luminosities of the 11 VLBI detected radio sources with known redshifts, computed adopting a spectral shape Sν ∝ ν-0.5 in the K-correction, range from ~1 × 10²³ to ~1 × 1025 W/Hz, with outlier 2 × 1026 W/Hz for the starburst with embedded AGN system J126242+621331 at z = 4.424. This is in the range of radio-luminous Seyfert galaxies and edge-darkened double-lobed (FR1-type) radio galaxies (NGC 1068 (3C 71) and M 87 (Virgo A/3C 274) have P1.4 GHz ~ 1 × 10²³ W/Hz) to radio-quiet QSOs. Note that large, double-lobed galaxies (FR2-type) at z ~ 1−2 have radio luminosities in excess of 1028 W/Hz. The 5 mJy FR1-type radio galaxy J123725+621128 is identified with an I = 22.9 compact galaxy at unknown redshift; assuming z ~ 1 its radio luminosity would be ~1025 W/Hz.
Considering their infrared/radio ratio q24, the VLBI detected objects have at most a mild radio excess: the AGN generated radio emission is of similar strength as the starburst generated radio emission. Figure 14 illustrates that point. The diagram compares the q24-values of the 11 VLBI sources with known redshifts with the q24-values of the 24 starburst objects with known redshift from Muxlow et al. (2005). Both samples contain upper limits, due to Spitzer upper limits. The diagram also specifies average q24-values for the samples (this time including the unknown redshift objects). While there is substantial overlap, the AGN stand out by a moderate q24-offset. The AGN sample displays an average ⟨ q24 ⟩ = −0.12, whereas ⟨ q24 ⟩ for SBs is 0.63 ± 0.43, which is consistent with the previous result of 0.52 ± 0.37 (Beswick et al. 2008). Objects having q24 < 0 are generally known as radio-excess objects (e.g. Donley et al. 2005). It is seen that four VLBI AGN, having q24 = 0.08, 0.55, 0.76 and 1.03, definitely would not classify as such. Others are seen to have a mild excess at most. Starburst candidate J123646+621629 at z = 0.502 is seen to have a radio excess (q24 = −0.7). It is puzzling that the VLBI observations do not detect this object; its MIPS upper limit may be erroneous or its radio core may be of variable strength (the object is unique in that sense). We stress that the integrated (VLA) 1.4 GHz flux densities often exceed the VLBI flux densities. The resolved, extended radio emission could originate in compact jets or lobes, or draw from diffuse galactic synchrotron radiation in the AGN host galaxies. The substantial 24 μ emission detected in these objects would argue for an ISM origin in dusty host galaxies. The SED decomposition technique involving the NIR, MIR, FIR, submm, and radio wavebands, recently employed by Del Moro et al. (2013), suggests symbiosis of dust-obscured star-formation and AGN in several dozens of weak, X-ray selected objects in the GOODS-N field. Their radio-excess sample contains eight of the VLBI AGN which provides confidence in both techniques. Surprisingly, a somewhat lower sSFR was established for these symbiotic objects, in comparison with 24 μ selected pure-starbursts. VLBI-undetected (candidate-) AGN from Del Moro et al. (2013) have larger q24-values, indicating a smaller AGN contribution. Their radio excess flux densities are in the range of ~50−150 μJy. The required global VLBI sensitivity (over a wide field) to tackle such radio sources is within reach; we are currently planning such observations. A detailed comparison of the results of the SED decomposition and the radio imaging techniques is beyond the scope of the present analysis and is postponed to a later paper.
Whereas X-ray selection is a powerful tool to select AGN samples, the present research underlines its shortcomings. Two of the VLBI-selected AGN, J123623+621642 and J123700+620909/GN16 remain without X-ray detection. The 2Ms Chandra observations of Alexander et al. (2003) yielded upper limits log L2 − 10 keV < 42.6 erg/s for both objects. The dusty nature of their host galaxies, referred to above, could be responsible for X-ray attenuation; this issue again wilt be dealt with in more detail in a later paper (the X-ray luminosities for the detected VLBI AGN are in the range 1041 − 1044 erg/s). It is in the meantime clear that combination of arcsec scale and milliarcsec scale radio imaging provides a very powerful and in principle straightforward tool to select samples of AGN and star-forming galaxies among the distant galaxy population. It is no surprise that such objects are among the main science drivers of the LOFAR and SKA radio telescopes.
To summarize, faint AGN are found in a variety of star-forming galaxies, with a wide range of dust obscurations, and a relative occurrence of ~25%. A subsequent paper will address the properties as well as selection techniques of faint AGN in more detail, and discuss the general AGN evolution over cosmic time.
5. Conclusions
Deep, high-resolution global VLBI observations at milliarcsec resolution together with deep arcsec-scale resolution radio imaging provide an extremely powerful way to separate faint AGN and starburst galaxies, and assess their symbiotic occurrence among the distant galaxy population. Using these techniques on the Hubble deep field north and its flanking fields, it is found that about 25% of star-forming galaxies of various types harbor faint AGN. Some classify as starbursts, such as the z = 4.42 system J123642+621331 and the z = 1.68 submm galaxy GN16/J123700+620909, and some can be X-ray obscured.
Radio-loud AGN obviously stand out in radio surveys through their radio morphology and luminosity.
Acknowledgments
This paper is dedicated to the memory of Seungyoup Chi, who, coming from South Korea, worked as promising Ph.D. student in Groningen and Dwingeloo, but passed away in the final year of his Ph.D. studies. Authors P.D.B. and M.A.G. are grateful for communications with Len Cowie and Ranga-Ram Chary, for discussions with Dave Alexander and Agnese del Moro, and for help with the graphics by Seyit Hocuk. Comments by an expert referee are also gratefully acknowledged.
References
- Alexander, D. M., Bauer, F. E., Brandt, W. N., et al. 2003, AJ, 126, 539 [NASA ADS] [CrossRef] [Google Scholar]
- Alexander, D. M., Bauer, F. E., Brandt, W. N., et al. 2011, ApJ, 738, 44 [NASA ADS] [CrossRef] [Google Scholar]
- Alonso-Herrero, A., Pérez-González, P. G., Alexander, D. M., et al. 2006, ApJ, 640, 167 [NASA ADS] [CrossRef] [Google Scholar]
- Aussel, H., Cesarsky, C. J., Elbaz, D., & Starck, J. L. 1999, A&A, 342, 313 [NASA ADS] [Google Scholar]
- Barger, A. J., Cowie, L. L., Trentham, N., et al. 1999, AJ, 117, 102 [NASA ADS] [CrossRef] [Google Scholar]
- Barger, A. J., Cowie, L. L., Brandt, W. N., et al. 2002, AJ, 124, 1839 [NASA ADS] [CrossRef] [Google Scholar]
- Barger, A. J., Cowie, L. L., & Wang, W.-H. 2008, ApJ, 689, 687 [NASA ADS] [CrossRef] [Google Scholar]
- Bauer, F. E., Alexander, D. M., Brandt, W. N., et al. 2004, AJ, 128, 2048 [NASA ADS] [CrossRef] [Google Scholar]
- Beswick, R. J., Muxlow, T. W. B., Thrall, H., Richards, A. M. S., & Garrington, S. T. 2008, MNRAS, 385, 1143 [NASA ADS] [CrossRef] [Google Scholar]
- Biggs, A. D., Younger, J. D., & Ivison, R. J. 2010, MNRAS, 408, 342 [NASA ADS] [CrossRef] [Google Scholar]
- Brandt, W. N., Hornschemeier, A. E., Alexander, D. M., et al. 2001, AJ, 122, 1 [NASA ADS] [CrossRef] [Google Scholar]
- Capak, P., Cowie, L. L., Hu, E. M., et al. 2004, AJ, 127, 180 [NASA ADS] [CrossRef] [Google Scholar]
- Casey, C. M., Chapman, S. C., Muxlow, T. W. B., et al. 2009, MNRAS, 395, 1249 [NASA ADS] [CrossRef] [Google Scholar]
- Chapman, S. C., Smail, I., Windhorst, R., Muxlow, T., & Ivison, R. J. 2004, ApJ, 611, 732 [NASA ADS] [CrossRef] [Google Scholar]
- Cohen, J. G., Hogg, D. W., Blandford, R., et al. 2000, ApJ, 538, 29 [NASA ADS] [CrossRef] [Google Scholar]
- Cowie, L. L., Barger, A. J., Hu, E. M., Capak, P., & Songaila, A. 2004, AJ, 127, 3137 [NASA ADS] [CrossRef] [Google Scholar]
- Daddi, E., Alexander, D. M., Dickinson, M., et al. 2007, ApJ, 670, 173 [NASA ADS] [CrossRef] [Google Scholar]
- Del Moro, A., Alexander, D. M., Mullaney, J. R., et al. 2013, A&A, 549, A59 [NASA ADS] [CrossRef] [EDP Sciences] [Google Scholar]
- Dickinson, M. 1998, in The Hubble Deep Field, eds. M. Livio, S. M. Fall, & P. C. Madau (Cambridge Univ. Press), 219 [Google Scholar]
- Dickinson, M., Hanley, C., Elston, R., et al. 2000, ApJ, 531, 624 [NASA ADS] [CrossRef] [Google Scholar]
- Donley, J. L., Rieke, G. H., Rigby, J. R., & Pérez-González, P. G. 2005, ApJ, 634, 169 [NASA ADS] [CrossRef] [Google Scholar]
- Donley, J. L., Rieke, G. H., Pérez-González, P. G., Rigby, J. R., & Alonso-Herrero, A. 2007, ApJ, 660, 167 [NASA ADS] [CrossRef] [Google Scholar]
- Donley, J. L., Koekemoer, A. M., Brusa, M., et al. 2012, ApJ, 748, 142 [NASA ADS] [CrossRef] [Google Scholar]
- Fabian, A. C. 1999, MNRAS, 308, L39 [NASA ADS] [CrossRef] [Google Scholar]
- Fiore, F., Puccetti, S., Brusa, M., et al. 2009, ApJ, 693, 447 [NASA ADS] [CrossRef] [Google Scholar]
- Garrett, M. A. 2002, A&A, 384, L19 [NASA ADS] [CrossRef] [EDP Sciences] [Google Scholar]
- Garrett, M. A., Porcas, R. W., Pedlar, A., Muxlow, T. W. B., & Garrington, S. T. 1999, New A Rev., 43, 519 [Google Scholar]
- Garrett, M. A., Muxlow, T. W. B., Garrington, S. T., et al. 2001, A&A, 366, L5 [NASA ADS] [CrossRef] [EDP Sciences] [Google Scholar]
- Georgakakis, A., Rowan-Robinson, M., Nandra, K., et al. 2010, MNRAS, 406, 420 [NASA ADS] [CrossRef] [Google Scholar]
- Hopkins, P. F., Hernquist, L., Cox, T. J., et al. 2006, ApJ, 639, 700 [NASA ADS] [CrossRef] [Google Scholar]
- Hornschemeier, A. E., Brandt, W. N., Garmire, G. P., et al. 2001, ApJ, 554, 742 [NASA ADS] [CrossRef] [Google Scholar]
- Lacy, M., Storrie-Lombardi, L. J., Sajina, A., et al. 2004, ApJS, 154, 166 [NASA ADS] [CrossRef] [Google Scholar]
- Luo, B., Brandt, W. N., Xue, Y. Q., et al. 2011, ApJ, 740, 37 [NASA ADS] [CrossRef] [Google Scholar]
- Lutz, D., Mainieri, V., Rafferty, D., et al. 2010, ApJ, 712, 1287 [NASA ADS] [CrossRef] [Google Scholar]
- Martínez-Sansigre, A., Rawlings, S., Lacy, M., et al. 2005, Nature, 436, 666 [NASA ADS] [CrossRef] [Google Scholar]
- Morrison, G. E., Owen, F. N., Dickinson, M., Ivison, R. J., & Ibar, E. 2010, ApJS, 188, 178 [NASA ADS] [CrossRef] [Google Scholar]
- Mullaney, J. R., Pannella, M., Daddi, E., et al. 2012, MNRAS, 419, 95 [NASA ADS] [CrossRef] [Google Scholar]
- Murphy, E. J., Chary, R.-R., Alexander, D. M., et al. 2009, ApJ, 698, 1380 [NASA ADS] [CrossRef] [Google Scholar]
- Muxlow, T. W. B., Richards, A. M. S., Garrington, S. T., et al. 2005, MNRAS, 358, 1159 [NASA ADS] [CrossRef] [Google Scholar]
- Phillips, A. C., Guzman, R., Gallego, J., et al. 1997, ApJ, 489, 543 [NASA ADS] [CrossRef] [Google Scholar]
- Pope, A., Borys, C., Scott, D., et al. 2005, MNRAS, 358, 149 [NASA ADS] [CrossRef] [Google Scholar]
- Pope, A., Scott, D., Dickinson, M., et al. 2006, MNRAS, 370, 1185 [NASA ADS] [CrossRef] [Google Scholar]
- Pope, A., Bussmann, R. S., Dey, A., et al. 2008, ApJ, 689, 127 [Google Scholar]
- Richards, E. A. 2000, ApJ, 533, 611 [NASA ADS] [CrossRef] [Google Scholar]
- Richards, E. A., Kellermann, K. I., Fomalont, E. B., Windhorst, R. A., & Partridge, R. B. 1998, AJ, 116, 1039 [NASA ADS] [CrossRef] [Google Scholar]
- Richards, E. A., Fomalont, E. B., Kellermann, K. I., et al. 1999, ApJ, 526, L73 [NASA ADS] [CrossRef] [PubMed] [Google Scholar]
- Schweitzer, M., Lutz, D., Sturm, E., et al. 2006, ApJ, 649, 79 [NASA ADS] [CrossRef] [Google Scholar]
- Seymour, N., Dwelly, T., Moss, D., et al. 2008, MNRAS, 386, 1695 [NASA ADS] [CrossRef] [Google Scholar]
- Silk, J. 2005, MNRAS, 364, 1337 [NASA ADS] [CrossRef] [Google Scholar]
- Stern, D., Eisenhardt, P., Gorjian, V., et al. 2005, ApJ, 631, 163 [NASA ADS] [CrossRef] [Google Scholar]
- Waddington, I., Windhorst, R. A., Cohen, S. H., et al. 1999, ApJ, 526, L77 [NASA ADS] [CrossRef] [Google Scholar]
- Xue, Y. Q., Luo, B., Brandt, W. N., et al. 2011, ApJS, 195, 10 [NASA ADS] [CrossRef] [Google Scholar]
All Tables
VLBI detected and undetected AGN and AGN candidates from the VLA+MERLIN 1.4 GHz survey (Muxlow et al. 2005).
All Figures
|
Fig. 1 Composite image of the radio (WSRT 1.4 GHz) – optical overlay image of the HDF-N and HFF, surrounded by postage stamp images of the twelve compact VLBI-detected radio sources. The cyan circles represent annuli of decreasing resolution and sensitivity, and are drawn at 2, 4, 6, and 8 arcmin radius w.r.t. the phase center which coincides with radio AGN VLA J123642+621331 (see text Sect. 3). |
| In the text | |
|
Fig. 2 VLA J123642+621331. In this and subsequent radio images, the clean beam FWHM is specified in the bottom left corner. Contours are plotted starting at 3σ and the relevant noise figure can be found below each image. The color coding is specified above each image. |
| In the text | |
|
Fig. 3 VLA J123644+621133. |
| In the text | |
|
Fig. 4 VLA J123646+621404. |
| In the text | |
|
Fig. 5 VLA J123652+621444. |
| In the text | |
|
Fig. 6 VLA J123608+621035. |
| In the text | |
|
Fig. 7 VLA J123623+621642. |
| In the text | |
|
Fig. 8 VLA J123642+621545. |
| In the text | |
|
Fig. 9 VLA J123700+620909, GN16. |
| In the text | |
|
Fig. 10 VLA J123714+620823. |
| In the text | |
|
Fig. 11 VLA J123716+621512. |
| In the text | |
|
Fig. 12 VLA J123716+621733. |
| In the text | |
|
Fig. 13 VLA J123721+621129. |
| In the text | |
|
Fig. 14 Values of q24 for SBs (black empty squares) and 11 global VLBI detections (red filled squares), as function of redshift. The thick dashed (black) and solid (red) lines represent the mean values for each sample, respectively, and the 1σ deviation is shown by thinner black dashed and red lines. |
| In the text | |
Current usage metrics show cumulative count of Article Views (full-text article views including HTML views, PDF and ePub downloads, according to the available data) and Abstracts Views on Vision4Press platform.
Data correspond to usage on the plateform after 2015. The current usage metrics is available 48-96 hours after online publication and is updated daily on week days.
Initial download of the metrics may take a while.