Free Access
Fig. 14
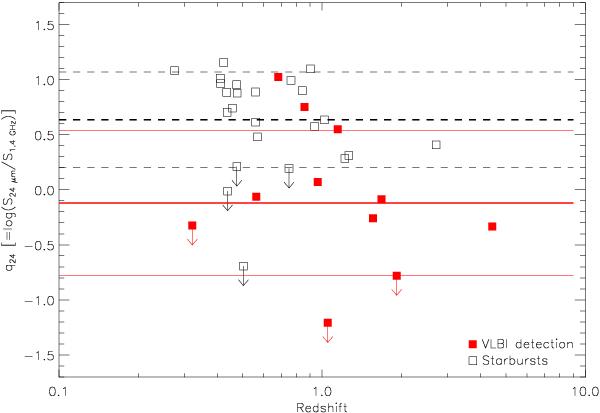
Values of q24 for SBs (black empty squares) and 11 global VLBI detections (red filled squares), as function of redshift. The thick dashed (black) and solid (red) lines represent the mean values for each sample, respectively, and the 1σ deviation is shown by thinner black dashed and red lines.
Current usage metrics show cumulative count of Article Views (full-text article views including HTML views, PDF and ePub downloads, according to the available data) and Abstracts Views on Vision4Press platform.
Data correspond to usage on the plateform after 2015. The current usage metrics is available 48-96 hours after online publication and is updated daily on week days.
Initial download of the metrics may take a while.