Free Access
Fig. 2
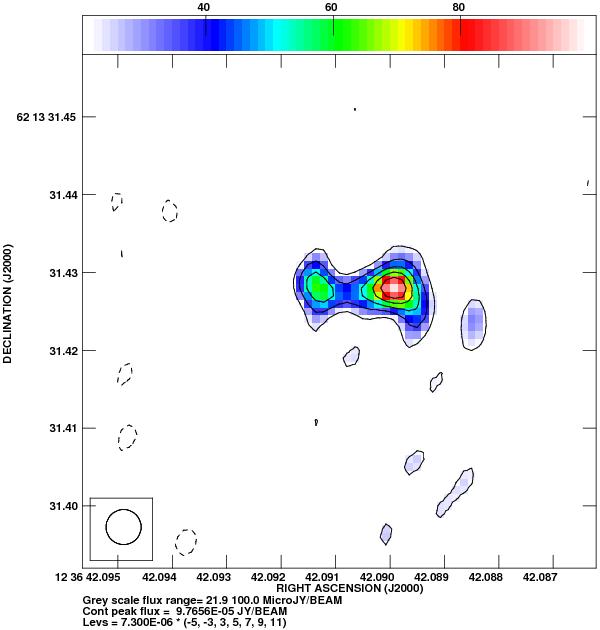
VLA J123642+621331. In this and subsequent radio images, the clean beam FWHM is specified in the bottom left corner. Contours are plotted starting at 3σ and the relevant noise figure can be found below each image. The color coding is specified above each image.
Current usage metrics show cumulative count of Article Views (full-text article views including HTML views, PDF and ePub downloads, according to the available data) and Abstracts Views on Vision4Press platform.
Data correspond to usage on the plateform after 2015. The current usage metrics is available 48-96 hours after online publication and is updated daily on week days.
Initial download of the metrics may take a while.