| Issue |
A&A
Volume 550, February 2013
|
|
|---|---|---|
| Article Number | A69 | |
| Number of page(s) | 12 | |
| Section | Extragalactic astronomy | |
| DOI | https://doi.org/10.1051/0004-6361/201220600 | |
| Published online | 29 January 2013 | |
On the multiplicity of supernovae within host galaxies
Departamento de Astronomía, Universidad de Chile, Casilla 36-D, Santiago, Chile
e-mail: This email address is being protected from spambots. You need JavaScript enabled to view it.
Received: 19 October 2012
Accepted: 13 December 2012
Abstract
Aims. We investigate the nature of multiple supernova hosting galaxies, and the types of events that they produce.
Methods. Using all known historical supernovae, we split host galaxies into samples containing single or multiple events. These samples are then characterised in terms of their relative supernova fractions and host properties.
Results. In multiple supernova hosts the ratio of type Ia to core-collapse events is lower than in single supernova hosts. For core-collapse events there is a suggestion that the ratio of types Ibc to type II events is higher in multiples than within single supernova hosts. This second increase is dominated by an increase in the number of SNIb. Within multiple supernova hosts, supernovae of any given type appear to “prefer” to explode in galaxies that are host to the same type of SN. We also find that multiple SN hosts have higher T-type morphologies.
Conclusions. While our results suffer from low number statistics, we speculate that their simplest interpretation is that star formation within galaxies is generally of an episodic and bursty nature. This leads to the supernovae detected within any particular galaxy to be dominated by those with progenitors of a specific age, rather than a random selection from standard relative supernova rates, as the latter would be expected if star formation was of a long-term continuous nature. We further discuss the supernova progenitor and star formation properties that may be important for understanding these trends, and also comment on a range of important selection effects within our sample.
Key words: galaxies: general / galaxies: star formation / supernovae: general
© ESO, 2013
1. Introduction
The extreme brightness of supernovae (SNe) enables their discovery in stellar populations outside of our own galaxy. Within the last 127 years there have been almost 6000 SN discoveries within external galaxies (see e.g. the IAU1 and Asiago2; Barbon et al. 1999, catalogues). The majority of galaxies within these catalogues have been host to 1 detected SN. However, within a significant fraction multiple SNe have been discovered. Here we investigate the nature of single and multiple SN hosting galaxies and the types of SNe that they produce.
The general consensus is of two distinct explosion scenarios which produce SNe. Type Ia SNe (SNIa henceforth) are believed to be thermonuclear explosions of accreting white dwarfs, while all other types are thought to arise from the core-collapse of massive stars (CC SNe). CC SNe are further divided into 3 main observational classes: SNII which show hydrogen in their spectra; SNIb which lack hydrogen but show helium; and SNIc which lack both hydrogen and helium in their spectra (see Filippenko 1997, for a review of SN classifications). SNII can be further sub-divided into IIP, IIL, IIb and IIn dependent on the nature of their light-curve and spectral features. However, for the current analysis we do not use these further sub-type classifications.
Several hundred galaxies have now been host to multiple observed SNe. Given the general consensus that a typical star-forming galaxy will produce a SN at a rate of around 1 event per 100 years, these multiple events are expected through simple statistical fluctuations. We may also expect certain galaxies to produce SNe at a higher rate if they are simply producing stars at a higher rate. The most pertinent questions would then appear to be: are there more galaxies producing multiple events than would be expected if drawing randomly from a standard SN rate? What are the characteristics of these multiple SN producers? Do multiple SN hosts produce the same types of events as their single SN counterparts?
Number of SNe in galaxies which have been host to 1, ≥2, then, 2, 3, and ≥4 events.
Number of CC SNe in galaxies which have been host to 1, ≥ 2, then, 2, 3, and ≥ 4 overall SNe, then within galaxies host to only multiple values of CC SNe.
The fact that some galaxies appear particularly efficient at producing SNe was noted in the early era of SNe study by Zwicky (1938), and some early considerations of their hosts were outlined in Kukarkin (1965). Richter & Rosa (1988) using a sample of 627 single- and 88 multiple-SN hosting galaxies, claimed that some galaxies go through an epoch of star formation (SF) at a rate 70 times higher than normal “inert” galaxies. However, this value was later revised downwards by both Guthrie (1990) and Li & Li (1995) to levels consistent with statistical fluctuations, once various selections effects were considered. One particular galaxy: NGC 2770 which had been host to 3 SNIb was analysed and discussed in detail by Thöne et al. (2009). While these authors estimated that there was only a 1.5% chance probability of observing three SNIb in 10 years, they assigned this to coincidence rather than some defining galaxy characteristic. This second aspect is the one we choose to concentrate on in the current paper: analysing the relative fractions of SNe as a function of host galaxy SN multiplicity.
The paper is organised as follows. First we define the galaxy and SN samples, then outline how we further divide these for analysis. Our results are presented in Sect. 3, followed by an analysis and discussion of possible selection effects which need to be considered in Sect. 4. We present a discussion of the implications of these results in Sect. 5, together with some remarks on those galaxies that have been host to the highest number of SNe thus far. We conclude in Sect. 6.
2. The supernova and galaxy sample
Our initial SN sample is that downloaded from the Asiago catalogue, with the most recent SN being SN2012cp discovered on the 23rd May 2012 (Cox 2012). This catalogue contains 5928 SN discoveries. We remove all SNe without definitive classifications as Ia, Ib, Ic or II. We also remove all SNe without identified hosts. After these culls we are left with a sample of 2384 SNe within 2117 host galaxies. We then search for repeated entries within the host galaxy listings, and thus separate galaxies into those hosting 1 or multiple events. This separation leads to samples of: 1898 SNe within single SN hosts; 187 galaxies each hosting 2 SNe; 22 galaxies each hosting 3; 7 galaxies each hosting 4; 1 galaxy hosting 5, 1 hosting 6, and 1 galaxy host to 7 SNe. The combined multiple sample (all SNe within galaxies hosting 2 or more SNe) has 486 SNe within 219 galaxies. Once these samples are formed we then investigate SN ratios and host galaxy properties within the different samples.
3. Results
3.1. SN ratios
In Table 1 we list the numbers of SNe of different types within galaxies host to different numbers of events; for both the full sample, plus a sub-sample of SNe occurring in star-forming galaxies. In Table 2 we list the numbers and respective percentages for only the CC SNe, first listing SNe within galaxies list to different overall numbers of events, then listing SNe within galaxies host to different numbers of CC events.
In Fig. 1 we show the distribution of SN types in single and multiple SN hosts. We observe that the ratio of SNIa to CC events decreases significantly in multiple SN hosts. In single SN hosts SNIa contribute 47% of the sample, while in multiple SN hosts this falls to 34%. The ratio of SNIa to CC events is 0.870 ± 0.040 in single SN hosts, and 0.514 ± 0.049 in multiple SN hosts (errors are estimated assuming Poisson errors: these are the Poisson statistics on the number of SNe within each sample, with this error then propagated to give a ratio error; all errors presented hereafter are estimated in the same way). We calculate that this difference is significant at the 5.7 sigma level.
SNIa are found in non star-forming elliptical galaxies, while CC events are usually not (see e.g. van den Bergh et al. 2005). Therefore we also investigate how the SNIa to CC ratio changes when we remove all non star-forming host galaxies. We do this by removing all SNe which have occurred in galaxies with negative T-type classifications (de Vaucouleurs 1959). The resulting distributions of events are shown in Fig. 2. The ratio of SNIa to CC events in this sub-sample is 0.578 ± 0.032 in single SN hosts, and 0.411 ± 0.043 in multiple SN hosts. The ratio is therefore still significantly smaller in multiple SN hosts, now at the 3.1 sigma level, assuming Poisson statistics. In Fig. 3 we show how the SNIa to CC ratio changes with SN multiplicity, with SNe within negative T-type galaxies removed.
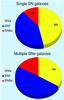 |
Fig. 1 Pie charts showing the different SN fractions of events within single (top) and multiple (bottom) SN hosts. |
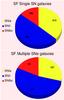 |
Fig. 2 Pie charts showing the different SN fractions of events within-star forming (i.e. excluding negative T-type host galaxies) single (top) and multiple (bottom) SN hosts. |
Given that SNIa and CC SNe arise from different progenitor systems, when discussing changes within the CC SN distribution we remove the SNIa. The relative fractions of CC SNe within single and multiple SN hosts are shown in Fig. 4. We see that the fraction of SNIbc of the total CC sample increases from 21% in single to 25% in multiple SN hosts. The ratio of SNIbc to SNII is 0.274 ± 0.021 in single SN hosts and 0.338 ± 0.047 in multiple SN hosts. Assuming Poisson errors (if the number of SNe within a distribution is less than 100, then we use Gehrels 1986 to estimate errors) this difference is significant at the 1.2 sigma level. We note that when one separates CC SNe into galaxies that have been host to 1, 2, 3 and ≥ 4 CC events as shown in Table 2, this significance is even lower.
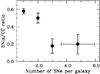 |
Fig. 3 Ratio of SNIa to CC events in positive T-type host galaxies as a function of SN multiplicity. The last point contains all SNe in galaxies which have been host to ≥ 4 events, with a weighted mean of 4.7 SNe. Error bars on the ratios are calculated using Poisson statistics (if the number of SNe within a distribution is less than 100, then we use Gehrels 1986 to estimate errors). The x-axis errors bars on the last point for ≥ 4 SNe show the standard deviation on the mean number of SNe within each galaxy within the bin. |
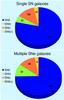 |
Fig. 4 Pie charts showing the different CC SN fractions of events within single (top) and multiple (bottom) SN hosts. |
In Fig. 5 we show the ratio of SNIbc to SNII as a function of number of SNe within each host galaxy. The ratio increases with number of hosted SNe. However, in the small number of galaxies with ≥ 4 SNe the ratio drops dramatically. In Fig. 6 the SNIbc sample is further split into sub-types: Ib and Ic, and we show how their relative rates to each other, but also to SNII, change with number of SNe per host. Here we find that the increase in the SNIbc to SNII ratio is dominated by an increase of SNIb. While the SNIc to SNII ratio shows a small increase, the increase in the number of SNIb to SNII is much more significant. In single SN hosts this ratio (SNIb to SNII) is 0.072 ± 0.011, while it is 0.140 ± 0.030 in multiple SN hosts. The differences between these distributions is significant at the 2.2 sigma level. In Fig. 6 we do not plot the distributions for galaxies host to ≥ 4 SNe due to low number statistics which would complicate the plots. However, the values are: Ib/Ic = 2/0, Ib/II = 2/33, and Ic/II = 0/33; these distributions are what we see in the last bin within Fig. 4. We will discuss this apparent lack of SNIc in the most multiple hosts in Sect. 5.2.
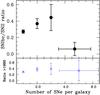 |
Fig. 5 SNIbc to SNII ratio as a function of host galaxy SN multiplicity. Top panel: the full sample. The bin for galaxies with ≥ 4 SNe has a weighted mean number of SNe of 4.7. Error bars on the ratios are calculated using Poisson statistics (if the number of SNe within a distribution is less than 100, then we use Gehrels 1986 to estimate errors). The x-axis errors bars on the last point for ≥ 4 SNe show the standard deviation on the mean number of SNe within each galaxy within the bin. Bottom panel: a sub-sample containing only SNe discovered after the year 1990 (see Sect. 4.2 for more discussion). Here the bin for galaxies with ≥ 4 SNe has a weighted mean number of SNe of 5. |
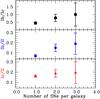 |
Fig. 6 CC SN ratios as a function of SN multiplicity of host galaxies. In the top panel the SNIb/SNIc ratio is plotted, in the middle the SNIb/SNII ratio, and in the bottom panel the SNIc/SNII ratio. Error bars are calculated using Poisson statistics (if the number of SNe within a distribution is less than 100, then we use Gehrels 1986 to estimate errors). |
The expected and observed ratios of SNe within galaxies host to 2, and host to 3 events.
3.2. Preferential multiplicity: SNe stick together!
In the previous section we discussed the possibility that host galaxy ratios of SN types change with the number of SNe reported within galaxies. We now turn our attention to investigating whether those SNe within multiple SN hosts are simply randomly distributed throughout the overall host galaxy sample, or whether the initial occurrence of a SN of one type increases the probability of occurrence of another SN of the same type. To test this hypothesis we proceed as follows. First, we concern ourselves with separating SNe into CC and SNIa. For each galaxy that has been host to 2 SNe we calculate a SNIa to CC ratio. This builds up observed numbers of galaxies, as a fraction of the total number of galaxies within that sample, that have been host to 2 SNIa and 0 CC, 0 SNIa and 2 CC, and 1 of each. We then calculate the expected galaxy fractions for each distribution using the SNIa to CC ratio for all galaxies host to 2 SNe (our sample of galaxies host to 2 SNe has 37% SNIa, 63% CC). These expected fractions for each distribution (2 SNIa and 0 CC, 0 SNIa and 2 CC, and 1 of each) are calculated by taking the overall observed fraction of SNIa to CC SNe within galaxies host to 2 SNe, and calculating the chance expectations of the fractions of galaxies that will be host to the different possible combinations of SNIa and CC SNe. We can then compare these expected ratios to those observed. The results are shown in Table 3. Next we do this same analysis for galaxies host to 3 SNe (with possible combinations: 0 SNIa and 3 CC, 1 SNIa and 2 CC, 2 SNIa and 1 CC, and 3 SNIa and 0 CC), where the expected ratios are calculated from the overall SN ratios in our sample in galaxies host to 3 SNe of: 21% SNIa, and 79% CC. We then repeat this process but exluding SNe within negative T-type host galaxies. For this sub-sample the ratios of events in galaxies host to 2 SNe are: 33% SNIa and 67% CC, and in galaxies host to 3 SNe: 15% SNIa and 85% CC.
Next, we concern ourselves with multiplicity of different CC types, hence separating SNe into SNII and SNIbc. Again we calculate the observed and expected ratios for galaxies with 2 CC SNe (with an overall fraction of 27% SNIbc and 73% SNII), and the observed and expected ratios for those galaxies which have been host to 3 CC events (fractions of 31% SNIbc and 69% SNII). All expected and observed ratios are shown in Table 3. We find that SNe of specific types appear to “prefer” to occur in galaxies containing a SN of the same type. This is seen in the fact that the observed ratios of SNe are all larger than those expected for galaxies which have been host to one specific SN type (initially just between Ia and CC, then between Ibc and II within the CC sample). In general the opposite is also true; in galaxies host to multiple SNe of different types the observed ratio is generally lower than the expected one. The number of galaxies contained within each distribution is shown in brackets in the last column of Table 3. We concede that these low numbers lead to statistically insignificant differences between the expected and observed distributions on individual ratios (as indicated by the errors on each ratio). However, given that every distribution of SN types which contain only one SN type has an observed ratio higher than that expected, we believe that we are observing an interesting real trend, and not simply the result of random fluctuations. Similar trends were suggested in Thöne et al. (2009).
3.3. Host galaxy T-types
Median and mean T-type values for SN host galaxy population separated by the number of hosted SNe.
In Table 4 we list the mean and median T-type (de Vaucouleurs 1959) values for distributions of single and multiple SN hosts. Galaxy T-type classifications basically follow the Hubble tuning fork: most negative values are spherical ellipticals, while most positive values are irregulars (see Buta et al. 1994). We observe clear differences in the distributions. In Fig. 7 we show these distributions for single and multiple SN hosts. A significant difference is found that multiple SN hosts have higher T-types than the single SN hosts: a KS-test gives less than 0.1% probability that the two T-type distributions are drawn from the same parent population. This is due in part to the smaller fraction of SNIa hosting galaxies within the multiple sample, which translates into a lack of elliptical, i.e. negative T-type, galaxies. However, if we remove negative T-types the probability of the two distributions (single and multiple SN hosts) being drawn from the same parent population is still less than 0.1%.
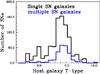 |
Fig. 7 Histograms of T-type distributions of galaxies which have hosted 1 (black), and ≥ 2 (blue) SN. |
In Fig. 8 we remove the SNIa and show the T-type distributions of the CC sample, separated into samples with galaxies that have hosted 1, 2, 3, and ≥ 4 SNe. There is a clear sequence of increasing galaxy T-type with SN multiplicity. This is most clearly shown in the median T-types for each distribution shown by the lines at at the top of the figure. We perform a KS-test on the CC SN host T-type distributions for single and multiple SN hosts, and find that there is less than 0.1% probability of the two being drawn from the same parent population.
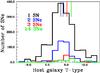 |
Fig. 8 Histograms of galaxy T-type distributions for samples which have hosted 1 (black), 2 (blue), 3 (red), and ≥ 4 (green) CC SNe. Coloured lines at the top of the figure indicate the positions of the median T-type values for each distribution. |
4. Selection effects
Before we discuss possible explanations for our results, some consideration of the selection effects within our sample is warranted. The current analysis is performed using data compiled from a large range of sources, and hence has numerous different selection effects convolved into one sample. The overwhelming majority of those sources are SN searches; either professional or amateur in nature. In any search a number of SN detection and host galaxy type selection effects will be present. The most prominent of these can probably be summarised as follows:
-
1)
As luminosity falls with distance it is easier to detect closer SNethat those further away.
-
2)
As SNe are transient events, their detection is dependent on how frequently one observes the same galaxy or area of sky; i.e. the cadence of any search.
-
3)
The rate of SNe within any given galaxy is dependent on the galaxy’s star formation rate (SFR) (e.g. Botticella et al. 2012), and in addition for the case of SNIa, its mass (Sullivan et al. 2006).
In Table 5 we list 3 host galaxy properties for each of our single and multiple SN host samples: galaxy recession velocity, galaxy apparent B-band magnitude, and galaxy absolute B-band magnitude. We show these parameters for the samples including SNIa and those without. Immediately we see that multiple SN hosts are closer to us and therefore brighter on the night sky, in both the samples including and excluding SNIa. These differences are statistically significant, with KS-test probabilities in each case being less than 0.1% that the two distributions are drawn from the same parent population. As we outline above, these differences are fully expected. What is of more interest, in relation to the physical understanding of our results, is whether differences in host galaxy properties persist once one removes the effect of distance. To probe this we list the median absolute host galaxy B-band magnitudes of each sample. Multiple SN hosts are, on average, around 0.5 mag brighter than their single SN hosting counterparts. A KS-test shows that the probability of observing this difference by chance is less than 0.1% (in both cases including and excluding SNIa). Later we discuss this luminosity difference in more detail with respect to the SN multiplicity of host galaxies.
Properties of galaxies, separated by number of hosted SNe.
4.1. Sub-sample 1: host galaxies with recession velocities <5000 km s-1
A different parameter which could affect our work is the ease of detecting different SNe types. SNIa are generally of higher luminosity than CC events (see e.g. Li et al. 2011), meaning that they should be easier to detect. It has been shown that while there exists a low-luminosity tail in the SNII population, their mean peak luminosities are not significantly different from those of SNIbc (Li et al. 2011). Hence, we do not expect any significant selection effect favouring the detection of SNIbc over SNII. To test whether differences in SN luminosities could affect our results we repeat our analysis but only including SNe which have host galaxies with recession velocities less than 5000 km s-1. This “nearby” sample has 1123 SNe within 938 galaxies. If there were any significant bias within our results dependent on SN luminosity, we would expect these to be removed once selecting only those SNe within nearby galaxies. With respect to the relative SN fractions within single and multiple SN hosts we still observe the trends presented above: 1) the SNIa to CC ratio (within SF galaxies) decreases in multiple SN hosts (0.427 ± 0.036 in single, and 0.336 ± 0.045 in multiple SN hosts); and 2) the SNIbc to SNII ratio increases in multiple SN hosts (0.295 ± 0.031 in single, and 0.359 ± 0.054 in multiple SN hosts).
4.2. Sub-sample 2: SNe discovered after 1990
Initially SNe were solely classified spectroscopically as types II or I based on the presence or absence of hydrogen in their spectra (Minkowski 1941) and it is was not until the 1980s (Wheeler & Harkness 1986) that the three separate type I classes; Ia, Ib and Ic were definitively catalogued. Hence, given that the longer a galaxy has been monitored, the higher the likelihood of multiple SN discoveries therein, one may speculate that one may bias their results due to incomplete SN classifications at earlier historical times. To test this we re-analyse our sample only including SNe that were discovered after 1990. We find that the results are almost completely consistent with those above: the SNIa to CC SN ratio still decreases with host galaxy SN multiplicity (0.859 ± 0.041 in single, and 0.558 ± 0.059 in multiple SN hosts), and the SNIbc to SNII ratio still increases (0.287 ± 0.022 in single, and 0.375 ± 0.056 in multiple SN hosts).
One of the anomalies of the above results is that while the SNIbc to SNII ratio increases as a function of SN multiplicity, in the last bin of SNe in galaxies of ≥ 4 detected SNe (top panel of Fig. 5), the ratio drops dramatically. As shown in the bottom panel of Fig. 5, in the sub-sample we analyse here the ratio within this final bin is now more consistent with that for other multiple (2 or 3 SNe) SN hosts.
5. Discussion
There are two main parameters which will affect the nature of SNe in any given stellar population (i.e. galaxy). The first is that of different progenitor properties; age, metallicity and binarity. The second is the nature of the SF; binary fraction, the IMF, and its continuous or episodic form. The combination of these parameters will then give rise to the relative SN fractions we observe in galaxies host to different numbers of SNe.
We have seen that SNIa are relatively less abundant than CC SNe within multiple SN hosts, and also that when 1 SNIa (or 1 CC) is found within a galaxy the probability of the next being of the same class is higher than that expected by chance. These observations can be explained by a progenitor age difference between that of relatively low mass progenitor SNIa, and the high mass progenitors of CC SNe. If we assume that this explanation is valid then this constrains the nature of SF within, in particular, the multiple SN hosts. If SF within galaxies were of a continuous nature, and had been so for a period of time longer than the time for the majority of SNIa from the initial epoch of SF to explode (i.e. the longest characteristic SNIa delay time: time between epoch of SF and that of explosion; e.g. > 2.4 Gyr, Maoz et al. 2011), then we would expect that the SNIa to CC ratio to be similar in single or multiple SN hosts. However, given that the fraction of SNIa goes down in multiple SN hosts, this tells us that the dominant SF within those hosts is of a shorter timescale. While this does not provide strong constraints on the duration of SF episodes within galaxies, significant claims have also been published for “prompt” SNIa delays times (see e.g. Mannucci et al. 2006), with SNIa being produced on timescales as short as <420 Myr (Maoz et al. 2011). Hence, if a significant fraction of SNIa were produced by progenitor systems with these short delay times, this would limit the duration of SF episodes within these galaxies to be less than this characteristic age.
There is a suggestion that the fraction of SNIbc increases with respect to SNII as a function of SN multiplicity. We also find that within multiple CC SN hosts there is a preference for SNII or SNIbc to be found together. This therefore hints at progenitor characteristics playing a role in CC SN multiplicity.
The question of which progenitor characteristics drive the differences we see between SNII and SNIbc is a currently debated topic. There is strong evidence that the dominant SNIIP events arise from red-supergiant progenitors in the mass range 8 − 16 M⊙ (Smartt et al. 2009; although see Walmswell & Eldridge 2012, for extending this mass range upwards). However, it is still unclear which is the dominant progenitor characteristic that produces a SNIbc event in place of a hydrogen rich explosion. One path is a massive single WR star (e.g. Gaskell et al. 1986), which has been stripped of its envelope through strong stellar winds. Another route is through less massive progenitors which have their envelopes removed through binary interaction (Podsiadlowski et al. 1992). Observationally while no direct detection of a SNIbc progenitor has been documented (Smartt 2009), these events are found closer to bright HII regions within galaxies than SNII (Anderson & James 2008; Anderson et al. 2012), suggesting that they arise from shorter lived, and hence more massive progenitors (also see Kelly et al. 2008; Kelly & Kirshner 2012).
Theoretically it is easier to produce a SNIbc at higher metallicity through both single (e.g. Heger et al. 2003) and binary (Eldridge et al. 2008) models. Studies of the global properties of host galaxies have observed that SNIbc arise in higher metallicity hosts than than SNII (Prieto et al. 2008; Boissier & Prantzos 2009; Arcavi et al. 2010). However, investigation of metallicities measured at the environments within galaxies have not found significant differences (see Anderson et al. 2010; Stoll et al. 2012; Sanders et al. 2012). Differences between the environment metallicities of SNIb and SNIc are also presently unclear, with various claims and counter claims in the literature (Anderson et al. 2010; Modjaz et al. 2011; Leloudas et al. 2011; Sanders et al. 2012; Modjaz 2012).
To understand the driving factors behind multiple SN hosts producing relatively more SNIbc than single galaxies one has to combine all the above knowledge (or lack thereof!) on progenitors, with knowledge of how host SF properties may change with galaxy type. Progenitor age as the driving effect for differences in CC SN relative ratios is much more problematic than in the case of SNIa. Even the relatively low mass progenitors of SNIIP will have delay times of less than a few 10 s of Myr. Starbursts within galaxies are generally observed to have timescales longer than this (Sanders & Mirabel 1996; Caputi et al. 2009). Hence, while there is the possibility of detecting any one galaxy which is host to only e.g. SNIc due to the very young nature of the SF, one would expect to see just as many cases where the dominant age was that producing SNIb or SNII, implying that the ratio of SNIbc to SNII should not change as a function of multiplicity. Therefore it is unclear how easily we can explain our results using this argument (see Habergham et al. 2012, for a more detailed discussion of this progenitor-starburst-age issue).
Progenitor age can more naturally explain why, when multiplicity does occur SNII are more often than expected found together with SNII, and that SNIbc are more often than expected found with SNIbc. One can speculate that within each one of these galaxies we are seeing SF of a specific age. This is then evidence for SF of a bursty, episodic nature, where at any one point the events being produced by a certain galaxy are from a SF episode of a certain age. This is also interesting as it implies that bursts of SF are galaxy wide, and poses a provocative question on how environments with large separations within galaxies “communicate” to produce SF of very similar ages3.
One may speculate that in place of age, progenitor metallicity is the driving force behind this increase in multiplicity. In Sect. 4 we found that multiple SN hosts are more luminous than their single hosting counterparts. More luminous galaxies are generally found to be more metal rich (Tremonti et al. 2004). Hence, multiple SN hosts are possibly more metal rich. This could then be compatible with the production of a higher fraction of SNIbc. However, the fact that this higher ratio is dominated by an increase in the number SNIb complicates the matter as SNIb are predicted (see e.g. Heger et al. 2003; Eldridge et al. 2008) to arise from lower metallicity progenitors than SNIc, with observations supporting this hypothesis (Modjaz 2012, although see Sanders et al. 2012). Importantly here there are no claims that SNIb arise from higher values than SNIc (or indeed observations that they have higher abundances than SNII; Anderson et al. 2010; Stoll et al. 2012; Sanders et al. 2012).
SNe discovered in the galaxy NGC 6946.
SNe discovered in the galaxy Arp 299.
The final parameter which could be driving our results is the nature of the IMF within different galaxies. While changes in the IMF with stellar population are often dismissed by the community, numerous claims exist of a varying IMF (see Bastian et al. 2010, for a review). How these changes could affect the relative fractions of SNe have been discussed previously in Habergham et al. (2010) and Habergham et al. (2012). If the IMF within a certain population is biased to produce stars of higher mass then this may be reflected in an increasing rate of SNe produced by higher mass stars; SNIbc.
We have also found that the intrinsic nature of multiple SN hosts are different from single SN hosts. As mentioned above multiple SN hosts tend to be intrinsically brighter. This may then relate to an increased overall SFR when compared to single SN hosts; more SF producing more SNe. However, an increase in the SFR by itself is insufficient to explain a change in the relative SN fractions. With respect to differences in host properties, a sequence of increasing host galaxy T-type is observed, as a function of host multiplicity, seen in Fig. 8. The T-type classification runs from − 6 to +11 (Buta et al. 1994), and overall forms a sequence of decreasing galaxy mass (hence also metallicity; e.g. Tremonti et al. 2004) and increasing specific SFR, while the absolute SFR peaks at T-types of around 4 − 5 (James et al. 2008). Indeed the median T-type values for the CC host galaxies presented in Table 4, are consistent with this peak in the absolute SFR of galaxies.
5.1. Extreme SNe producers
4 galaxies have been host to 6 or more discovered SNe. Here we briefly discuss these galaxies and their SN populations in more detail. We again note; our aim is not to attempt to explain why these galaxies have produced the largest numbers of SNe. Our interest is to explore whether the SN populations within these galaxies are similar to “normal” galaxies, and what we can infer from asking these questions.
5.1.1. NGC 6946
NGC 6946 holds the record for highest number of discovered SNe with 9 events. In Table 6 information on each SN is given, and the positions of each SN within the galaxy are show in Fig. 9. NGC 6946 is host to a well observed and modelled nuclear starburst (Engelbracht et al. 1996), and has a relatively high star formation rate (SFR) of around 3 M⊙ yr-1 (e.g. Thöne et al. 2009). The galaxy is a face-on spiral with a Hubble classification of SABcd, and is located at a distance of 6.0 Mpc, with a heliocentric recession velocity of 40 km s-1 (all values taken from NED).
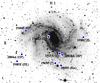 |
Fig. 9 Positions of the 9 SNe within the galaxy NGC 6946. This image is a negative R-band image obtained with the Isaac Newton Telescope (INT). These data were initially analysed in Anderson & James (2008). The orientation is indicated on the image, and the scale bar (to the right of “N”) shows 20 arcsec. |
It is interesting that all SNe within this galaxy with definitive classifications are SNII. Even that which has a “I” classification has been claimed to be of SNII (Tammann 1982). To test if this apparent bias towards SNII production can simply be explained by statistical fluctuations we randomly draw SN types from the local rates given by Li et al. (2011) 10 000 times. First we do this including SNIa. We find a chance probability of 2.1% that one would find 7 out of 7 SNII (if we assume that SN 1939C is of type II the probability of 8 from 8 is 1.3%). This is suggestive that the SF producing the SNe within this galaxy is related to a SF episode with an age of less than a few 10 s Myr and not from continuous SF. This is because if the current SF were part of a continuous cycle then we would expect to see SNe with different characteristic progenitor delay times. When we draw only from the CC relative fractions, this probability increases to 12.9% (9.8% for 8 SNII). Hence, one may speculate that all of the SNe within NGC 6946 originate from a single episode of star formation with an age of 10 − 20 Myr ago; i.e. on longer timescales than SNIbc progenitors (for stellar model predictions see e.g. Heger et al. 2003).
5.1.2. Arp 299
Second place in the list for SN producers goes to the interacting galaxy pair (NGC 3690 and IC 694): Arp 299. In Table 7 information on each SN is given. The positions of the SNe within this system are shown in Fig. 10.
SNe discovered in the galaxy NGC 4303.
Arp 299 is by far the most distant of the extreme SN producers discussed here at 43.9 Mpc, with a heliocentric recession velocity of 3121 km s-1 (both taken from NED). Due to the merging of the two components, Arp 299 is going through an episode of intense merger-driven burst of SF (e.g. Weedman 1972; Rieke & Low 1972; Gehrz et al. 1983), and various young starburst regions have been identified by e.g. Alonso-Herrero et al. (2000). Through radio observations (Neff et al. 2004; see also Pérez-Torres et al. 2009; Ulvestad 2009; Romero-Cañizales et al. 2011; Bondi et al. 2012) the nucleus of component IC 694 has been dubbed a “SN factory” with an estimated CC SN rate of 0.1 − 1 events per year. The CC SN rate of the whole system has been estimated to be 1.5 − 1.9 SNe per year (Mattila et al. 2012). Almost all of these SNe are undetected at optical wavelengths (see e.g. Mattila et al. 2012) due to the huge extinction present in the nuclear regions (Alonso-Herrero et al. 2000).
Anderson et al. (2011) discussed this galaxy and its SNe in detail, speculating that both the relative numbers of SNIb and SNIIb to other SNII events, plus their radial positions pointed to either progenitor age or IMF effect being at play to produce the SNe types and their distribution within the system. Arp 299 has been host to a range of CC SN types, but no SNIa. The probability of no SNIa by chance is 16%. Perhaps interesting is that no SNIc are detected in this galaxy either, although the chance probability of this is only 25%. Anderson et al. (2011) speculated that if the CC SNe within this galaxy are all associated with a recent, interaction driven star burst, then we may be observing the galaxy at such a time where all the stars destined to explode as SNIc have already done so, due to their possible shorter lifetimes.
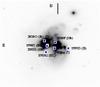 |
Fig. 10 Positions of the 7 SNe that have been discovered within Arp 299. This image is a negative R-band image obtained with the Isaac Newton Telescope (INT). These data were initially analysed in Anderson & James (2008). The orientation is indicated on the image, and the scale bar (to the right of “N”) shows 20 arcsec. |
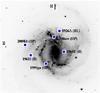 |
Fig. 11 Positions of the 6 SNe that have been discovered within NGC 4303. This image is a negative R-band image obtained with the Isaac Newton Telescope (INT). These data were initially analysed in Anderson & James (2008). The orientation is indicated on the image, and the scale bar (to the right of “N”) shows 20 arcsec. |
5.1.3. NGC 4303
As show in Table 8, the 6 SNe that have been discovered within NGC 4303 (Messier 61) are all SNII. SN positions within the galaxy are shown in Fig. 11. NGC 4303 is a face-on SABbc type galaxy located at a distance of 16.5 Mpc, with a recession velocity of 1566 km s-1 (from NED). This galaxy has a high star formation rate of ~10 M⊙ yr-1 (Thöne et al. 2009; also see e.g. Momose et al. 2010), and has nuclear starburst activity (Colina & Wada 2000). The detection of 6 SNe all of type II by chance has a 4.0% probability if we include SNIa, and 17.4% if we draw SNe only from a CC ratio distribution. Hence, we speculate that this is again pointing to a recent (but not too recent for SNIbc to be detected) burst of SF dominating over long-term continuous SF within this galaxy.
5.1.4. NGC 5236
NGC 5236 (Messier 83) has been host to 6 SNe, however given that only 3 have definitive classifications, it was not considered as part of the “ ≥ 4” sample above. NGC 5236 is a relatively face-on galaxy with a morphological SABc classification, located at a distance of ~7 Mpc, with a recession velocity of 513 km s-1 (NED). It is host to a nuclear starburst (see e.g. Bohlin et al. 1983), and has a SFR of a few solar masses per year (depending on the SF tracer used; Thöne et al. 2009; see Talbot 1980, for an overview of SF in the galaxy). The SNe are listed in Table 9 and their positions within NGC 5236 are shown in Fig. 12. The occurrence of long-lasting radio emission from both SN1940B and SN1957D led Richter & Rosa (1984) to classify these as SNII. Hence, if we assume these classifications we again observe a galaxy producing an abundance of SNII explosions.
SNe discovered in the galaxy NGC 5236.
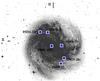 |
Fig. 12 Positions of the 6 SNe that have been discovered within NGC 5236. This is a negative r-band image downloaded from the Canadian Astronomy Data Centre website: http://www4.cadc-ccda.hia-iha.nrc-cnrc.gc.ca/dss/. The orientation is indicated on the image, and the scale bar (to the right of “N”) shows 20 arcsec. |
5.2. The relative lack of SNIc in highly multiple host galaxies
Not only have zero SNIc been reported in any of the 4 galaxies considered above, but none have been documented in any galaxy which has been host to ≥4 classified SNe. Drawing from the local CC rates (Li et al. 2011), we find that this absence is significant, with only a 0.05% chance probability (no SNIc out of 46 SNe detected in galaxies host to ≥ 4 SNe). Even if we only consider the 4 galaxies above, we find that there is only a 0.6% chance probability of detecting no SNIc if the galaxies were intrinsically producing relative CC SN rates consistent those in the local Universe. This is a puzzling result, especially given the discussion above on how progenitor age and metallicity effects could be driving the overall higher relative rates of SNIbc to SNII within multiple SN hosts. One possible explanation could be that if the progenitors of SNIc are of high mass, e.g. ≥ 25−30 M⊙, then, each SF episode only produces a few explosions on very short timescales, and hence the probability of detecting numerous SNIc from the same SF episode is lower than that of lower mass progenitor SNII and SNIb (although we note that in terms of the rate of their detection SNIb are rarer events than SNIc; e.g. Li et al. 2011).
While the required detailed modelling of SF and progenitor properties to gain further answers to these results are beyond the scope of this paper, the possibility of gaining knowledge on both is intriguing, especially when larger statistics for this type of study are available.
6. Conclusions
Using a compilation of the vast majority of SNe discoveries to date, we have investigated whether the relative fractions of SNe change with SN multiplicity of host galaxies. We find that the SNIa to CC ratio decreases as a function of host multiplicity, which is to be expected given the difference in delay times between the two types of SN. There is a suggestion that the SNIbc to SNII ratio rises with increasing host galaxy SN multiplicity, while in the most prolific SNe producers this trend is reversed and we see an abundance of SNII. The initial increase is dominated by an increase in the number of SNIb; a result which is difficult to interpret given the current consensus on both progenitor characteristics and SF processes.
We also find that within multiple SN hosts, SNe of the same types (i.e. SNIa, SNII or SNIbc) appear to be found more often together than would be expected by chance. If these trends are real then this would constrain SF to be episodic and bursty in nature, rather than a continuous process integrated over the lifetime of each galaxy.
We reiterate here; while bursty, episodic SF can explain why SNe types like to occur together, it does not explain the overall increase in the SNIbc to SNII ratio in multiple SN hosts.
Acknowledgments
The annoymous referee is thanked for constructive comments which improved the manuscript. We thank Francisco Forster, Santiago Gonzalez-Gaitan, Stacey Habergham, and Phil James for useful discussion which has greatly improved the content of this work. J. P. Anderson acknowledges support by CONICYT through FONDECYT grant 3110142, and by the Millennium Center for Supernova Science (P10-064-F), with input from “Fondo de Innovación para la Competitividad, del Ministerio de Economía, Fomento y Turismo de Chile”. This research has made use of the NASA/IPAC Extragalactic Database (NED) which is operated by the Jet Propulsion Laboratory, California Institute of Technology, under contract with the National Aeronautics and Space Administration and of data provided by the Central Bureau for Astronomical Telegrams. We acknowledge the usage of the HyperLeda database (http://leda.univ-lyon1.fr).
References
- Alonso-Herrero, A., Rieke, G. H., Rieke, M. J., & Scoville, N. Z. 2000, ApJ, 532, 845 [NASA ADS] [CrossRef] [Google Scholar]
- Anderson, J. P., & James, P. A. 2008, MNRAS, 390, 1527 [NASA ADS] [Google Scholar]
- Anderson, J. P., Covarrubias, R. A., James, P. A., Hamuy, M., & Habergham, S. M. 2010, MNRAS, 407, 2660 [NASA ADS] [CrossRef] [Google Scholar]
- Anderson, J. P., Habergham, S. M., & James, P. A. 2011, MNRAS, 416, 567 [NASA ADS] [CrossRef] [Google Scholar]
- Anderson, J. P., Habergham, S. M., James, P. A., & Hamuy, M. 2012, MNRAS, 424, 1372 [NASA ADS] [CrossRef] [Google Scholar]
- Arbour, R., & Boles, T. 2008, Central Bureau Electronic Telegrams, 1234, 1 [NASA ADS] [Google Scholar]
- Arcavi, I., Gal-Yam, A., Kasliwal, M. M., et al. 2010, ApJ, 721, 777 [NASA ADS] [CrossRef] [Google Scholar]
- Ayani, K., & Yamaoka, H. 1999, IAU Circ., 7336, 1 [NASA ADS] [Google Scholar]
- Barbon, R., Ciatti, F., & Rosino, L. 1979, A&A, 72, 287 [Google Scholar]
- Barbon, R., Cappellaro, E., Ciatti, F., Turatto, M., & Kowal, C. T. 1984, A&AS, 58, 735 [NASA ADS] [Google Scholar]
- Barbon, R., Buondí, V., Cappellaro, E., & Turatto, M. 1999, A&AS, 139, 531 [NASA ADS] [CrossRef] [EDP Sciences] [Google Scholar]
- Bastian, N., Covey, K. R., & Meyer, M. R. 2010, ARA&A, 48, 339 [NASA ADS] [CrossRef] [Google Scholar]
- Bennett, J. C. 1968, Mon. Notes Astron. Soc. S. Afr., 27, 95 [NASA ADS] [Google Scholar]
- Bohlin, R. C., Cornett, R. H., Hill, J. K., Smith, A. M., & Stecher, T. P. 1983, ApJ, 274, L53 [NASA ADS] [CrossRef] [Google Scholar]
- Boissier, S., & Prantzos, N. 2009, A&A, 503, 137 [NASA ADS] [CrossRef] [EDP Sciences] [Google Scholar]
- Bondi, M., Pérez-Torres, M. A., Herrero-Illana, R., & Alberdi, A. 2012, A&A, 539, A134 [NASA ADS] [CrossRef] [EDP Sciences] [Google Scholar]
- Botticella, M. T., Smartt, S. J., Kennicutt, R. C., et al. 2012, A&A, 537, A132 [NASA ADS] [CrossRef] [EDP Sciences] [Google Scholar]
- Buta, R. J. 1982, PASP, 94, 578 [NASA ADS] [CrossRef] [Google Scholar]
- Buta, R., Mitra, S., de Vaucouleurs, G., & Corwin, Jr., H. G. 1994, AJ, 107, 118 [NASA ADS] [CrossRef] [Google Scholar]
- Caputi, K. I., Lilly, S. J., Aussel, H., et al. 2009, ApJ, 707, 1387 [NASA ADS] [CrossRef] [Google Scholar]
- Chakraborti, S., Prabhu, T., Anupama, G. C., et al. 2008, Central Bureau Electronic Telegrams, 1638, 1 [NASA ADS] [Google Scholar]
- Colina, L., & Wada, K. 2000, ApJ, 529, 845 [NASA ADS] [CrossRef] [Google Scholar]
- Cox, L. A. 2012, Central Bureau Electronic Telegrams, 3130, 1 [NASA ADS] [Google Scholar]
- de Vaucouleurs, G. 1959, Handbuch der Physik, 53, 275 [Google Scholar]
- Dimai, A., & Li, W. 1999, IAU Circ., 7335, 1 [NASA ADS] [Google Scholar]
- Eldridge, J. J., Izzard, R. G., & Tout, C. A. 2008, MNRAS, 384, 1109 [NASA ADS] [CrossRef] [Google Scholar]
- Engelbracht, C. W., Rieke, M. J., Rieke, G. H., & Latter, W. B. 1996, ApJ, 467, 227 [NASA ADS] [CrossRef] [Google Scholar]
- Filippenko, A. V. 1997, ARA&A, 35, 309 [NASA ADS] [CrossRef] [Google Scholar]
- Filippenko, A. V., Matheson, T., Leibundgut, B., et al. 1993, IAU Circ., 5720, 1 [NASA ADS] [Google Scholar]
- Filippenko, A. V., Foley, R. J., & Swift, B. 2002, IAU Circ., 8007, 2 [NASA ADS] [Google Scholar]
- Filippenko, A. V., Foley, R. J., Treu, T., & Malkan, M. A. 2004, IAU Circ., 8414, 1 [NASA ADS] [Google Scholar]
- Gaskell, C. M., Cappellaro, E., Dinerstein, H. L., et al. 1986, ApJ, 306, L77 [NASA ADS] [CrossRef] [Google Scholar]
- Gehrels, N. 1986, ApJ, 303, 336 [NASA ADS] [CrossRef] [Google Scholar]
- Gehrz, R. D., Sramek, R. A., & Weedman, D. W. 1983, ApJ, 267, 551 [NASA ADS] [CrossRef] [Google Scholar]
- Guthrie, B. N. G. 1990, A&A, 234, 84 [NASA ADS] [Google Scholar]
- Habergham, S. M., Anderson, J. P., & James, P. A. 2010, ApJ, 717, 342 [NASA ADS] [CrossRef] [Google Scholar]
- Habergham, S. M., James, P. A., & Anderson, J. P. 2012, MNRAS, 424, 2841 [NASA ADS] [CrossRef] [Google Scholar]
- Heger, A., Fryer, C. L., Woosley, S. E., Langer, N., & Hartmann, D. H. 2003, ApJ, 591, 288 [NASA ADS] [CrossRef] [Google Scholar]
- Herrero-Illana, R., Romero-Canizales, C., Perez-Torres, M. A., et al. 2012, The Astronomer’s Telegram, 4432, 1 [NASA ADS] [Google Scholar]
- Humason, M. L., Kearns, C. E., & Gomes, A. M. 1962, PASP, 74, 215 [NASA ADS] [CrossRef] [Google Scholar]
- James, P. A., Knapen, J. H., Shane, N. S., Baldry, I. K., & de Jong, R. S. 2008, A&A, 482, 507 [NASA ADS] [CrossRef] [EDP Sciences] [Google Scholar]
- Jha, S., Garnavich, P., Challis, P., et al. 1999, IAU Circ., 7089, 2 [NASA ADS] [Google Scholar]
- Kelly, P. L., & Kirshner, R. P. 2012, ApJ, 759, 107 [NASA ADS] [CrossRef] [Google Scholar]
- Kelly, P. L., Kirshner, R. P., & Pahre, M. 2008, ApJ, 687, 1201 [NASA ADS] [CrossRef] [Google Scholar]
- Kirshner, R., & Bryan, J. 1980, IAU Circ., 3534, 2 [NASA ADS] [Google Scholar]
- Kukarkin, B. V. 1965, Astrophysics, 1, 245 [NASA ADS] [CrossRef] [Google Scholar]
- Lampland, C. O. 1936, PASP, 48, 320 [NASA ADS] [CrossRef] [Google Scholar]
- Leloudas, G., Gallazzi, A., Sollerman, J., et al. 2011, A&A, 530, A95 [NASA ADS] [CrossRef] [EDP Sciences] [Google Scholar]
- Leonard, D. C., & Cenko, S. B. 2005, The Astronomer’s Telegram, 431, 1 [NASA ADS] [Google Scholar]
- Li, W. 2002, IAU Circ., 8005, 1 [NASA ADS] [Google Scholar]
- Li, W., & Li, Z. 1995, A&A, 301, 666 [NASA ADS] [Google Scholar]
- Li, W., Li, C., Wan, Z., Filippenko, A. V., & Moran, E. C. 1998, IAU Circ., 6830, 1 [NASA ADS] [Google Scholar]
- Li, W., Leaman, J., Chornock, R., et al. 2011, MNRAS, 412, 1441 [NASA ADS] [CrossRef] [Google Scholar]
- Mannucci, F., Della Valle, M., & Panagia, N. 2006, MNRAS, 370, 773 [NASA ADS] [CrossRef] [Google Scholar]
- Maoz, D., Mannucci, F., Li, W., et al. 2011, MNRAS, 412, 1508 [NASA ADS] [CrossRef] [Google Scholar]
- Mattila, S., & Kankare, E. 2010, Central Bureau Electronic Telegrams, 2145, 1 [NASA ADS] [Google Scholar]
- Mattila, S., Greimel, R., Gerardy, C., et al. 2005, IAU Circ., 8473, 1 [NASA ADS] [Google Scholar]
- Mattila, S., Kankare, E., Datson, J., & Pastorello, A. 2010, Central Bureau Electronic Telegrams, 2149, 1 [NASA ADS] [Google Scholar]
- Mattila, S., Dahlen, T., Efstathiou, A., et al. 2012, ApJ, 756, 111 [NASA ADS] [CrossRef] [Google Scholar]
- Minkowski, R. 1941, PASP, 53, 224 [NASA ADS] [CrossRef] [Google Scholar]
- Modjaz, M. 2012, in IAU Symp., 279, 207 [Google Scholar]
- Modjaz, M., Kirshner, R., Challis, P., & Berlind, P. 2005, IAU Circ., 8475, 2 [NASA ADS] [Google Scholar]
- Modjaz, M., Kewley, L., Bloom, J. S., et al. 2011, ApJ, 731, L4 [NASA ADS] [CrossRef] [Google Scholar]
- Momose, R., Okumura, S. K., Koda, J., & Sawada, T. 2010, ApJ, 721, 383 [NASA ADS] [CrossRef] [Google Scholar]
- Neff, S. G., Ulvestad, J. S., & Teng, S. H. 2004, ApJ, 611, 186 [NASA ADS] [CrossRef] [Google Scholar]
- Newton, J., Puckett, T., & Orff, T. 2010, Central Bureau Electronic Telegrams, 2144, 2 [NASA ADS] [Google Scholar]
- Oksanen, A. 2008, Central Bureau Electronic Telegrams, 1635, 1 [NASA ADS] [Google Scholar]
- Patchett, B., & Branch, D. 1972, MNRAS, 158, 375 [NASA ADS] [Google Scholar]
- Paturel, G., Petit, C., Prugniel, P., et al. 2003, A&A, 412, 45 [NASA ADS] [CrossRef] [EDP Sciences] [Google Scholar]
- Pérez-Torres, M. A., Romero-Cañizales, C., Alberdi, A., & Polatidis, A. 2009, A&A, 507, L17 [NASA ADS] [CrossRef] [EDP Sciences] [Google Scholar]
- Podsiadlowski, P., Joss, P. C., & Hsu, J. J. L. 1992, ApJ, 391, 246 [NASA ADS] [CrossRef] [Google Scholar]
- Prieto, J. L., Stanek, K. Z., & Beacom, J. F. 2008, ApJ, 673, 999 [NASA ADS] [CrossRef] [Google Scholar]
- Puckett, T., Peoples, M., Itagaki, K., et al. 2006, IAU Circ., 8781, 2 [NASA ADS] [Google Scholar]
- Qiu, Y. L., Qiao, Q. Y., Hu, J. Y., & Li, W. 1999, IAU Circ., 7088, 2 [NASA ADS] [Google Scholar]
- Richter, O.-G., & Rosa, M. 1984, A&A, 140, L1 [NASA ADS] [Google Scholar]
- Richter, O.-G., & Rosa, M. 1988, A&A, 206, 219 [NASA ADS] [Google Scholar]
- Richtler, T., & Sadler, E. M. 1983, A&A, 128, L3 [NASA ADS] [Google Scholar]
- Rieke, G. H., & Low, F. J. 1972, ApJ, 176, L95 [NASA ADS] [CrossRef] [Google Scholar]
- Romero-Cañizales, C., Mattila, S., Alberdi, A., et al. 2011, MNRAS, 415, 2688 [NASA ADS] [CrossRef] [Google Scholar]
- Rosino, L. 1971, Information Bulletin on Variable Stars, 515, 1 [NASA ADS] [Google Scholar]
- Ryder, S., Mattila, S., Kankare, E., & Perez-Torres, M. 2010, Central Bureau Electronic Telegrams, 2189, 1 [NASA ADS] [Google Scholar]
- Sanders, D. B., & Mirabel, I. F. 1996, ARA&A, 34, 749 [NASA ADS] [CrossRef] [Google Scholar]
- Sanders, N. E., Soderberg, A. M., Levesque, E. M., et al. 2012, ApJ, 758, 132 [NASA ADS] [CrossRef] [Google Scholar]
- Smartt, S. J. 2009, ARA&A, 47, 63 [NASA ADS] [CrossRef] [Google Scholar]
- Smartt, S. J., Eldridge, J. J., Crockett, R. M., & Maund, J. R. 2009, MNRAS, 395, 1409 [NASA ADS] [CrossRef] [Google Scholar]
- Stanishev, V., Pastorello, A., & Pursimo, T. 2008, Central Bureau Electronic Telegrams, 1235, 1 [NASA ADS] [Google Scholar]
- Stoll, R., Prieto, J. L., Stanek, K. Z., & Pogge, R. W. 2012 [arXiv:1205.2338] [Google Scholar]
- Sullivan, M., Le Borgne, D., Pritchet, C. J., et al. 2006, ApJ, 648, 868 [NASA ADS] [CrossRef] [Google Scholar]
- Talbot, Jr., R. J. 1980, ApJ, 235, 821 [NASA ADS] [CrossRef] [Google Scholar]
- Tammann, G. A. 1982, in Supernovae: A Survey of Current Research, eds. M. J. Rees, & R. J. Stoneham, NATO ASIC Proc., 90, 371 [Google Scholar]
- Thöne, C. C., Michałowski, M. J., Leloudas, G., et al. 2009, ApJ, 698, 1307 [NASA ADS] [CrossRef] [Google Scholar]
- Treffers, R. R., Leibundgut, B., Filippenko, A. V., & Richmond, M. W. 1993, IAU Circ., 5718, 1 [NASA ADS] [Google Scholar]
- Tremonti, C. A., Heckman, T. M., Kauffmann, G., et al. 2004, ApJ, 613, 898 [NASA ADS] [CrossRef] [Google Scholar]
- Tsvetkov, D. Y. 1994, Astron. Lett., 20, 374 [NASA ADS] [Google Scholar]
- Ulvestad, J. S. 2009, AJ, 138, 1529 [NASA ADS] [CrossRef] [Google Scholar]
- van Buren, D., Jarrett, T., Terebey, S., et al. 1994, IAU Circ., 5960, 2 [NASA ADS] [Google Scholar]
- van den Bergh, S., Li, W., & Filippenko, A. V. 2005, PASP, 117, 773 [NASA ADS] [CrossRef] [Google Scholar]
- Walmswell, J. J., & Eldridge, J. J. 2012, MNRAS, 419, 2054 [NASA ADS] [CrossRef] [Google Scholar]
- Weedman, D. W. 1972, ApJ, 171, 5 [NASA ADS] [CrossRef] [Google Scholar]
- Wheeler, J. C., & Harkness, R. P. 1986, in Galaxy Distances and Deviations from Universal Expansion, eds. B. F. Madore, & R. B. Tully, NATO ASIC Proc., 180, 45 [Google Scholar]
- Wild, P., & Barbon, R. 1980, IAU Circ., 3532, 1 [NASA ADS] [Google Scholar]
- Wood, R., & Andrews, P. J. 1974, MNRAS, 167, 13 [NASA ADS] [Google Scholar]
- Zwicky, F. 1938, ApJ, 88, 529 [NASA ADS] [CrossRef] [Google Scholar]
- Zwicky, F. 1942, ApJ, 96, 28 [NASA ADS] [CrossRef] [Google Scholar]
- Zwitter, T., Munari, U., & Moretti, S. 2004, Central Bureau Electronic Telegrams, 95, 1 [NASA ADS] [Google Scholar]
All Tables
Number of SNe in galaxies which have been host to 1, ≥2, then, 2, 3, and ≥4 events.
Number of CC SNe in galaxies which have been host to 1, ≥ 2, then, 2, 3, and ≥ 4 overall SNe, then within galaxies host to only multiple values of CC SNe.
The expected and observed ratios of SNe within galaxies host to 2, and host to 3 events.
Median and mean T-type values for SN host galaxy population separated by the number of hosted SNe.
All Figures
|
Fig. 1 Pie charts showing the different SN fractions of events within single (top) and multiple (bottom) SN hosts. |
| In the text | |
|
Fig. 2 Pie charts showing the different SN fractions of events within-star forming (i.e. excluding negative T-type host galaxies) single (top) and multiple (bottom) SN hosts. |
| In the text | |
|
Fig. 3 Ratio of SNIa to CC events in positive T-type host galaxies as a function of SN multiplicity. The last point contains all SNe in galaxies which have been host to ≥ 4 events, with a weighted mean of 4.7 SNe. Error bars on the ratios are calculated using Poisson statistics (if the number of SNe within a distribution is less than 100, then we use Gehrels 1986 to estimate errors). The x-axis errors bars on the last point for ≥ 4 SNe show the standard deviation on the mean number of SNe within each galaxy within the bin. |
| In the text | |
|
Fig. 4 Pie charts showing the different CC SN fractions of events within single (top) and multiple (bottom) SN hosts. |
| In the text | |
|
Fig. 5 SNIbc to SNII ratio as a function of host galaxy SN multiplicity. Top panel: the full sample. The bin for galaxies with ≥ 4 SNe has a weighted mean number of SNe of 4.7. Error bars on the ratios are calculated using Poisson statistics (if the number of SNe within a distribution is less than 100, then we use Gehrels 1986 to estimate errors). The x-axis errors bars on the last point for ≥ 4 SNe show the standard deviation on the mean number of SNe within each galaxy within the bin. Bottom panel: a sub-sample containing only SNe discovered after the year 1990 (see Sect. 4.2 for more discussion). Here the bin for galaxies with ≥ 4 SNe has a weighted mean number of SNe of 5. |
| In the text | |
|
Fig. 6 CC SN ratios as a function of SN multiplicity of host galaxies. In the top panel the SNIb/SNIc ratio is plotted, in the middle the SNIb/SNII ratio, and in the bottom panel the SNIc/SNII ratio. Error bars are calculated using Poisson statistics (if the number of SNe within a distribution is less than 100, then we use Gehrels 1986 to estimate errors). |
| In the text | |
|
Fig. 7 Histograms of T-type distributions of galaxies which have hosted 1 (black), and ≥ 2 (blue) SN. |
| In the text | |
|
Fig. 8 Histograms of galaxy T-type distributions for samples which have hosted 1 (black), 2 (blue), 3 (red), and ≥ 4 (green) CC SNe. Coloured lines at the top of the figure indicate the positions of the median T-type values for each distribution. |
| In the text | |
|
Fig. 9 Positions of the 9 SNe within the galaxy NGC 6946. This image is a negative R-band image obtained with the Isaac Newton Telescope (INT). These data were initially analysed in Anderson & James (2008). The orientation is indicated on the image, and the scale bar (to the right of “N”) shows 20 arcsec. |
| In the text | |
|
Fig. 10 Positions of the 7 SNe that have been discovered within Arp 299. This image is a negative R-band image obtained with the Isaac Newton Telescope (INT). These data were initially analysed in Anderson & James (2008). The orientation is indicated on the image, and the scale bar (to the right of “N”) shows 20 arcsec. |
| In the text | |
|
Fig. 11 Positions of the 6 SNe that have been discovered within NGC 4303. This image is a negative R-band image obtained with the Isaac Newton Telescope (INT). These data were initially analysed in Anderson & James (2008). The orientation is indicated on the image, and the scale bar (to the right of “N”) shows 20 arcsec. |
| In the text | |
|
Fig. 12 Positions of the 6 SNe that have been discovered within NGC 5236. This is a negative r-band image downloaded from the Canadian Astronomy Data Centre website: http://www4.cadc-ccda.hia-iha.nrc-cnrc.gc.ca/dss/. The orientation is indicated on the image, and the scale bar (to the right of “N”) shows 20 arcsec. |
| In the text | |
Current usage metrics show cumulative count of Article Views (full-text article views including HTML views, PDF and ePub downloads, according to the available data) and Abstracts Views on Vision4Press platform.
Data correspond to usage on the plateform after 2015. The current usage metrics is available 48-96 hours after online publication and is updated daily on week days.
Initial download of the metrics may take a while.