Fig. 3
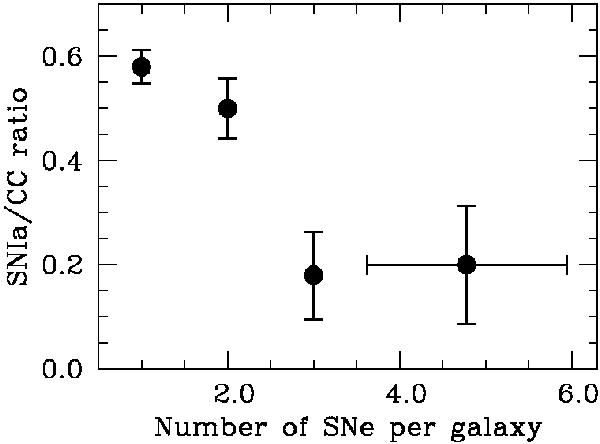
Ratio of SNIa to CC events in positive T-type host galaxies as a function of SN multiplicity. The last point contains all SNe in galaxies which have been host to ≥ 4 events, with a weighted mean of 4.7 SNe. Error bars on the ratios are calculated using Poisson statistics (if the number of SNe within a distribution is less than 100, then we use Gehrels 1986 to estimate errors). The x-axis errors bars on the last point for ≥ 4 SNe show the standard deviation on the mean number of SNe within each galaxy within the bin.
Current usage metrics show cumulative count of Article Views (full-text article views including HTML views, PDF and ePub downloads, according to the available data) and Abstracts Views on Vision4Press platform.
Data correspond to usage on the plateform after 2015. The current usage metrics is available 48-96 hours after online publication and is updated daily on week days.
Initial download of the metrics may take a while.