Fig. 4
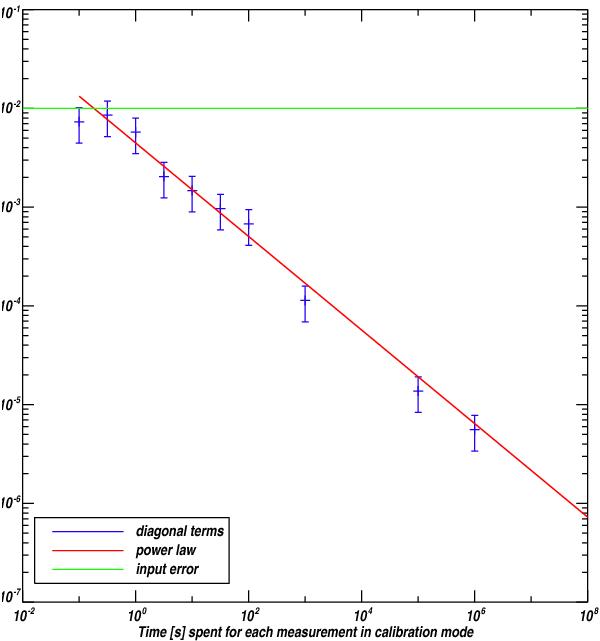
Results of the self-calibration simulation for the diagonal terms of the Jones
matrix of the half-wave plate. We show the residual error (in blue) on these
parameters as a function of the measuring time spent on each baseline on the
calibration mode. The red line represents a power law of the shape
 with NET the noise equivalent temperature of the bolometers,
T the temperature of the polarized source,
and tb the measuring time spent on each baseline. This
law gives the limit of the relative accuracy that can be achieved on the systematic
parameters according to the measuring time spent per baseline. The green line
represents the input error on the systematic effects of the half-wave plate in the
simulation given in Table 1.
with NET the noise equivalent temperature of the bolometers,
T the temperature of the polarized source,
and tb the measuring time spent on each baseline. This
law gives the limit of the relative accuracy that can be achieved on the systematic
parameters according to the measuring time spent per baseline. The green line
represents the input error on the systematic effects of the half-wave plate in the
simulation given in Table 1.
Current usage metrics show cumulative count of Article Views (full-text article views including HTML views, PDF and ePub downloads, according to the available data) and Abstracts Views on Vision4Press platform.
Data correspond to usage on the plateform after 2015. The current usage metrics is available 48-96 hours after online publication and is updated daily on week days.
Initial download of the metrics may take a while.