Fig. 2
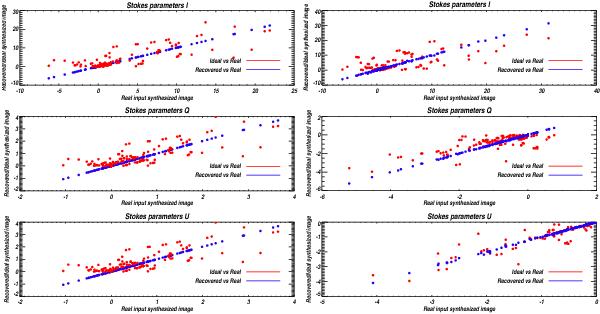
Results of the self-calibration simulation for the synthesized images
 ,
,
 , and
, and
 for the
X focal plane on the right and
Y focal plane on the left for an instrument with
nine primary horns, nine bolometers, and ten pointings for a time spent on
calibration mode for each baseline of tb = 1 s and
100 realizations. These plots represent scatter plots of ideal vs. real synthesized
image in red and of recovered vs. real in blue. The red plots show the corruption
after adding the systematic effects defined in Table 1. The blue plots show that the corruption is solved after applying the
self-calibration method.
for the
X focal plane on the right and
Y focal plane on the left for an instrument with
nine primary horns, nine bolometers, and ten pointings for a time spent on
calibration mode for each baseline of tb = 1 s and
100 realizations. These plots represent scatter plots of ideal vs. real synthesized
image in red and of recovered vs. real in blue. The red plots show the corruption
after adding the systematic effects defined in Table 1. The blue plots show that the corruption is solved after applying the
self-calibration method.
Current usage metrics show cumulative count of Article Views (full-text article views including HTML views, PDF and ePub downloads, according to the available data) and Abstracts Views on Vision4Press platform.
Data correspond to usage on the plateform after 2015. The current usage metrics is available 48-96 hours after online publication and is updated daily on week days.
Initial download of the metrics may take a while.