Free Access
Fig. 6
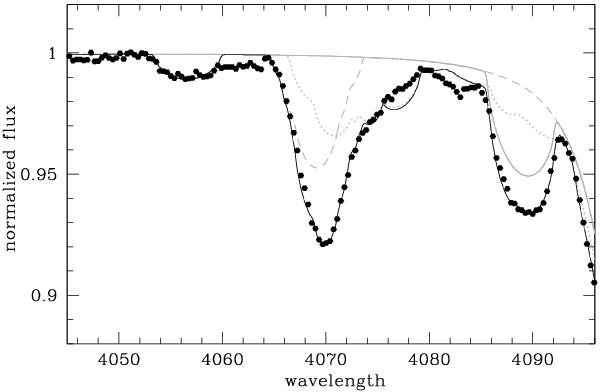
Complex blends in the blue wing of Hδ line including lines of O ii (dotted), C iii (dashed), and Si iv (light grey solid). The composite spectrum for the abundances given in Table 4 represents the solid dark grey line. The renormalised, disentangled primary’s spectrum is shown by black dots.
Current usage metrics show cumulative count of Article Views (full-text article views including HTML views, PDF and ePub downloads, according to the available data) and Abstracts Views on Vision4Press platform.
Data correspond to usage on the plateform after 2015. The current usage metrics is available 48-96 hours after online publication and is updated daily on week days.
Initial download of the metrics may take a while.