Fig. 10
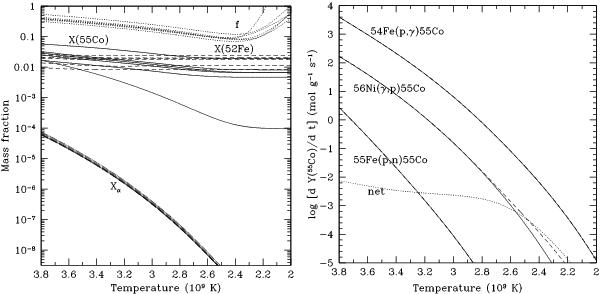
Nuclear evolution as a function of temperature during expansion and cooling. Left: evolution of the mass fractions of 55Co (solid lines), 52Fe (dashed lines), and α (dot-dashed lines), for six different sets of parameters, as given in Table 3. The dotted lines show the quantity f, defined in Eq. (16). Right: evolution of the molar fluxes of the main reactions contributing to the abundance of 55Co for the same set of parameters as in Fig. 2. Reactions building 55Co are drawn as solid lines, reactions destroying it are drawn as dashed lines, and the absolute value of the net rate of dY(55Co)/dt is drawn as a dotted line. Upper curves are for the reactions 54Fe + p ⇆ 55Co + γ, in which both line types are nearly indistinguishable. The middle curves are for the reactions 56Ni + γ ⇆ 55Co + p. Finally, the bottom curves are for the reactions 55Fe + p ⇆ 55Co + n.
Current usage metrics show cumulative count of Article Views (full-text article views including HTML views, PDF and ePub downloads, according to the available data) and Abstracts Views on Vision4Press platform.
Data correspond to usage on the plateform after 2015. The current usage metrics is available 48-96 hours after online publication and is updated daily on week days.
Initial download of the metrics may take a while.