Fig. 2
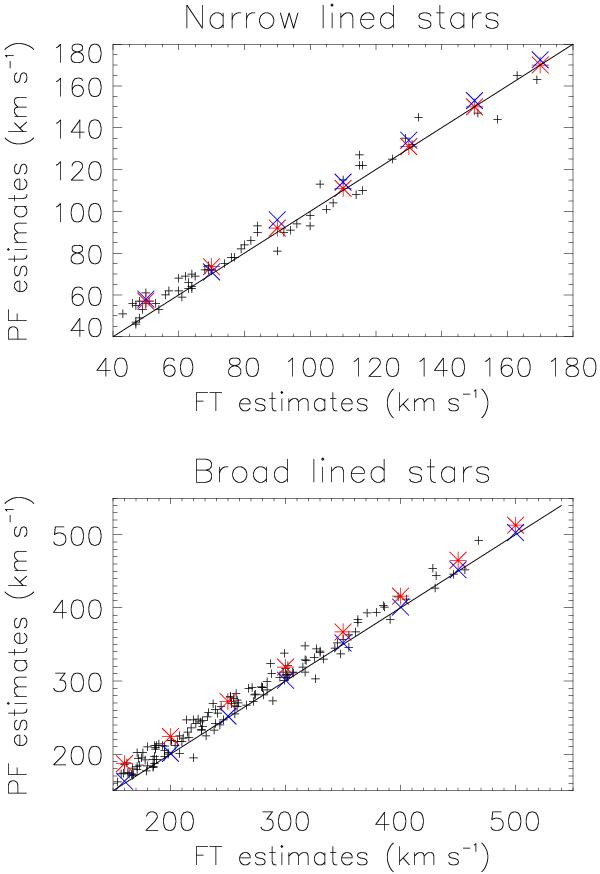
Comparison of projected rotational velocities estimated using the FT and PF methodologies. The upper figure is for the narrower lined stars (line set 1), whilst the lower figure is for the broader lined (line set 2) sample. Also shown are the results of the simulation – crosses: He i 4713 Å; asterisks: Si iii 4552 Å or He i 4387 Å.
Current usage metrics show cumulative count of Article Views (full-text article views including HTML views, PDF and ePub downloads, according to the available data) and Abstracts Views on Vision4Press platform.
Data correspond to usage on the plateform after 2015. The current usage metrics is available 48-96 hours after online publication and is updated daily on week days.
Initial download of the metrics may take a while.