| Issue |
A&A
Volume 550, February 2013
|
|
|---|---|---|
| Article Number | A66 | |
| Number of page(s) | 11 | |
| Section | Extragalactic astronomy | |
| DOI | https://doi.org/10.1051/0004-6361/201220270 | |
| Published online | 28 January 2013 | |
Fermi-LAT and Suzaku observations of the radio galaxy Centaurus B
1 W. W. Hansen Experimental Physics Laboratory, Kavli Institute for Particle Astrophysics and Cosmology, Department of Physics and SLAC National Accelerator Laboratory, Stanford University, Stanford, CA 94305, USA
e-mail: This email address is being protected from spambots. You need JavaScript enabled to view it.
2 Hiroshima Astrophysical Science Center, Hiroshima University, 1-3-1 Kagamiyama, Higashi-Hiroshima, 739-8526 Hiroshima, Japan
e-mail: This email address is being protected from spambots. You need JavaScript enabled to view it.
3 Institute of Space and Astronautical Science, Japan Aerospace Exploration Agency, 3-1-1 Yoshinodai, Chuo-ku, Sagamihara, 252-5210 Kanagawa, Japan
4 Astronomical Observatory, Jagiellonian University, ul. Orla 171, 30-244 Kraków, Poland
5 Sydney Institute for Astronomy, School of Physics A28, University of Sydney, NSW 2006, Australia
6 National Research Council Research Associate, National Academy of Sciences, Washington, DC 20001, resident at Naval Research Laboratory, Washington, DC 20375, USA
7 Research Institute for Science and Engineering, Waseda University, 3-4-1, Okubo, Shinjuku, 169-8555 Tokyo, Japan
8 European Space Astronomy Centre of ESA, PO Box 78, Villanueva de la Cañada, 28691 Madrid, Spain
Received: 21 August 2012
Accepted: 23 November 2012
Abstract
Centaurus B is a nearby radio galaxy positioned in the southern hemisphere close to the Galactic plane. Here we present a detailed analysis of about 43 months of accumulated Fermi-LAT data of the γ-ray counterpart of the source initially reported in the 2nd Fermi-LAT catalog, and of newly acquired Suzaku X-ray data. We confirm its detection at GeV photon energies and analyze the extension and variability of the γ-ray source in the LAT dataset, in which it appears as a steady γ-ray emitter. The X-ray core of Centaurus B is detected as a bright source of a continuum radiation. We do not detect, however, any diffuse X-ray emission from the known radio lobes, with the provided upper limit only marginally consistent with the previously claimed ASCA flux. Two scenarios that connect the X-ray and γ-ray properties are considered. In the first one, we assume that the diffuse non-thermal X-ray emission component is not significantly below the derived Suzaku upper limit. In this case, modeling the inverse-Compton emission shows that the observed γ-ray flux of the source may in principle be produced within the lobes. This association would imply that efficient in-situ acceleration of the radiating electrons is occurring and that the lobes are dominated by the pressure from the relativistic particles. In the second scenario, with the diffuse X-ray emission well below the Suzaku upper limits, the lobes in the system are instead dominated by the magnetic pressure. In this case, the observed γ-ray flux is not likely to be produced within the lobes, but instead within the nuclear parts of the jet. By means of synchrotron self-Compton modeling, we show that this possibility could be consistent with the broad-band data collected for the unresolved core of Centaurus B, including the newly derived Suzaku spectrum.
Key words: acceleration of particles / radiation mechanisms: non-thermal / X-rays: galaxies / gamma rays: galaxies / galaxies: jets / galaxies: individual: Centaurus B
© ESO, 2013
1. Introduction
Centaurus B (PKS 1343−601) is a relatively nearby (z = 0.0129, West & Tarenghi 1989, distance D = 56 Mpc) radio-loud active galaxy. Despite its high radio flux (Centaurus B is in fact the fifth brightest radio galaxy in the sky, Jones et al. 2001), it is relatively poorly studied. This is mainly due to both its proximity to the Galactic plane and the fact that it is not accessible from the northern hemisphere. Initial studies suggested Centaurus B was surrounded by a rich cluster of galaxies hidden behind the Milky Way and related to one of the largest concentrations of mass in the local Universe, the Great Attractor (Lynden-Bell et al. 1988; Kraan-Korteweg & Woudt 1999; Kraan-Korteweg & Lahav 2000). In addition, Centaurus B was found close to the arrival detection of the ultra-high energy cosmic ray (UHECR) event detected recently by the P. Auger Observatory (Abraham et al. 2007; Nagar & Matulich 2008; Moskalenko et al. 2009). It is currently not clear whether a positional coincidence between nearby active galactic nuclei (AGN) and the arrival directions of UHECRs robustly identifies those AGN as UHECR sources or implies instead that nearby AGN simply trace the mass distribution in the Universe (see Moskalenko et al. 2009).
Searches for the members of the galaxy cluster surrounding Centaurus B at optical wavelengths are significantly hampered by a heavy foreground extinction in the direction of the source. Near-infrared surveys showed an enhancement of galaxies around the discussed object. The galaxies found in the survey, however, were not enhanced as significantly as expected and consisted of mostly late-type systems (Nagayama et al. 2004; Kraan-Korteweg et al. 2005; Schröder et al. 2007). Hence it seems unlikely that Centaurus B resides in a particularly massive cluster, although a somewhat less rich environment, like a poor cluster or a galaxy group, remains a valid option. This conclusion is in agreement with the X-ray studies presented in the literature, which did not reveal a presence of any extended atmosphere of hot ionized gas surrounding the source. In particular, the Einstein Observatory detected only an X-ray point source coincident with the radio core of Centaurus B. Deep observations with the ASCA satellite confirmed the Einstein detection and also provided some evidence for a low surface-brightness diffuse X-ray halo around the core (Tashiro et al. 1998). The total luminosity of this halo, L2 − 10 keV ≃ 3.7 × 1041 erg s-1, which was proposed to be associated with the extended radio lobes in the system, is however orders of magnitude below that expected for a rich cluster (see the discussion in Jones et al. 2001). Using the ROSAT All Sky Survey data, Ebeling et al. (2002) did not find any X-ray feature, neither point-like nor extended, at the source position and thus excluded large amounts of X-ray emitting gas analogous to those found in rich clusters.
A comprehensive study of Centaurus B at radio wavelengths was presented by Jones et al. (2001). The compiled maps revealed prominent jets surrounded by diffuse lobes. The largest angular size of the radio structure is ≃ 24′, corresponding to a projected size of about ≃ 380 kpc for a conversion scale of 265 pc arcsec-1. The actual physical extension of the lobes in Centaurus B may be larger than this, because of a likely intermediate inclination to the line of sight implied by the jet-to-counterjet brightness and polarization asymmetry. Both the large-scale radio morphology of the source and its total radio power (L1.4 GHz ≃ 5 × 1041 erg s-1) suggest a classification of the object as an intermediate case between Fanaroff-Riley class I (FR I) and class II (FR II).
As noted before, Tashiro et al. (1998) claimed the X-ray detection of the core and the tentative discovery of an extended halo coinciding with the radio lobes of Centaurus B. They argued that the most likely origin of the diffuse X-ray halo, best fitted by a power-law model with the photon index ΓX ≃ 1.88 ± 0.19, is inverse-Compton emission of the non-thermal electrons within the lobes interacting with the cosmic microwave background (CMB) photon field. This detection, which is only the second of its kind following the case of Fornax A (Feigelson et al. 1995; Kaneda et al. 1995), was followed by a number of analogous studies targeting other radio galaxies with the XMM-Newton, Suzaku, and Chandra X-ray satellites (Kataoka & Stawarz 2005; Croston et al. 2005; Isobe et al. 2011, and references therein).For Centaurus B, the Chandra observations resolved the inner parts of the main (SW) jet at arcsec scale, thanks to its excellent spatial resolution (Marshall et al. 2005). The detection of the SW jet on slightly larger scales was also reported in the preliminary analysis of the XMM data presented in Tashiro et al. (2005).
Here we present a detailed analysis of Centaurus B at γ-ray frequencies with the Large Area Telescope (LAT) onboard the Fermi satellite, together with an X-ray analysis of the Suzaku data we have acquired very recently. Centaurus B is associated with the 2FGL J1346.5 − 6027 object in the Fermi-LAT Second Source Catalog (2FGL; Ackermann et al. 2011; Nolan et al. 2012). In our investigation, we focus on the extended lobes in this system, since their high integrated radio flux (dominating over that of the unresolved core by about an order of magnitude) and exceptional extension on the sky (about half of a degree) suggest that Centaurus B could be one of the few nearby radio galaxies for which the diffuse lobes may be detected and resolved, or at least viewed as extended, in γ-rays. The motivation of the study came from the robust identification of several other radio galaxies with Fermi-LAT sources (Abdo et al. 2009a,b, 2010c; Kataoka et al. 2011), including the case of Centaurus A for which the 600 kpc-scale lobes have in fact been successfully resolved at GeV photon energies (Abdo et al. 2010b,a). These studies have provided important clues for understanding energy dissipation processes within the extended lobes of radio-loud AGN in general and particle acceleration mechanisms related to the production of UHECRs in particular (see in this context Hardcastle et al. 2009a; O’Sullivan et al. 2009; Pe’er & Loeb 2012).
2. Fermi-LAT data
The Fermi Gamma-ray Space Telescope was launched on 2008 June 11. The LAT onboard the Fermi satellite is a pair conversion telescope, equipped with solidstate silicon trackers and cesium iodide calorimeters, sensitive to photons in a very broad energy band from ~20 MeV to ≳ 300 GeV. The LAT has a large effective area (~8000 cm2 above 1 GeV for on-axis events), instantaneously viewing ≃ 2.4 sr of the sky with a good angular resolution (68% containment radius better than ~1° above 1 GeV). The tracker of the LAT is divided into front and back sections. The front section, composed of thin converters, has a better angular resolution (68% containment radius ≃ 0.7° at 1 GeV) than that of the back section (68% containment radius ≃ 1.2° at 1 GeV) composed of thicker converters. Details of the LAT instrument and data reduction are described in Atwood et al. (2009).
The LAT data used here were collected during ~43 months, from 2008 August 4 to 2012 February 18. The source event class was chosen, and photons beyond the Earth zenith angle of 100° were excluded to reduce the background from the Earth limb. We also excluded times when the region of interest (ROI) intersects a given zenith angle cut. The P7SOURCE_V6 instrument response functions were used for the analysis presented in this paper.
We utilized gtlike in the Science Tools analysis package1 for spectral fits. With gtlike, a binned maximum likelihood fit is performed on the spatial and spectral distributions of the observed γ-rays to optimize spectral parameters of the input model, taking into account the energy dependence of the point-spread function (PSF). Analysis using gtlike is done in a 20° × 20° region around Centaurus B, which is referred to as a ROI. The fitting model includes other point sources, whose positions are fixed at the values provided in the 2FGL catalog. The Galactic diffuse emission is modeled by gal_2yearp7v6_v0.fits, while an isotropic component (instrumental and extragalactic diffuse backgrounds) is modeled by isotropic_p7v6source.txt. Both background models are the standard diffuse emission models released by the LAT team. In each gtlike run, all point sources within the ROI and diffuse components in the model are fitted with their normalizations being free. In the analysis, we also include 2FGL sources outside the ROI but within 15° of Centaurus B, with their parameters fixed at those given in the 2FGL catalog.
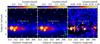 |
Fig. 1 (Left) Fermi-LAT count map using front events above 1 GeV around Centaurus B in units of counts per pixel. The pixel size is |


2.1. Detection and source localization
Figure 1 shows a smoothed count map of a 10° × 10° region around Centaurus B above 1 GeV, a corresponding background model map, and the background-subtracted count map. Here only front events are used to achieve the best angular resolution. The map includes contributions from the Galactic diffuse emission, isotropic diffuse background, and nearby discrete sources. The model parameters of diffuse components and nearby sources are set at the best-fit values obtained by gtlike using the data above 1 GeV. In this fitting model, the 2FGL source associated with Centaurus B (2FGL J1346.6−6027) is not included. The γ-ray source associated with Centaurus B is visible in the background-subtracted map. The figure also shows residuals on the Galactic plane. These may be attributed to the imperfection of the Galactic diffuse model and/or the contributions from discrete sources not resolved from the background, since the residuals are seen exclusively on the Galactic plane, where the Galactic diffuse emission components have high intensities and complex spatial structures. This interpretation is also supported by the fact that all bright residuals are diffuse and/or accompanied by nearby 2FGL sources. On the other hand, Fig. 1 indicates that the source associated with Centaurus B is a discrete feature on the residual map. Actually, the region of Centaurus B is relatively off the plane: 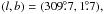 where the Galactic diffuse emission is almost uniform with Galactic longitude and decreases monotonically with Galactic latitude.
To study this γ-ray source in detail, we generated a test statistic (TS) map around Centaurus B, where TS is defined as − 2Δln(likelihood) obtained by gtlike between models of the null hypothesis and an alternative. In this paper, we refer to TS as a comparison between models without a target source (null hypothesis) and with the source (alternative hypothesis), unless otherwise mentioned. In the presented TS map, TS at each grid position is calculated by placing a point source with a power-law energy distribution with photon index set free.
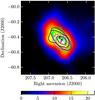 |
Fig. 2 Fermi-LAT TS map obtained with a maximum likelihood analysis using front events above 1 GeV in the vicinity of Centaurus B. Linear green contours of the 843 MHz radio map are overlaid (McAdam 1991). The blue ellipse compatible with the radio lobes is also shown. Black cross and contours represent the estimated position and the positional errors at 68% and 95% confidence levels in this analysis, respectively. Magenta cross and ellipses represent the position and the errors at 68% and 95% confidence levels of 2FGL J1346.6 − 6027. The position of the core of Centaurus B is represented as a diamond. |
Figure 2 shows the close-up TS map of Centaurus B, using front data above 1 GeV. The figure clearly shows that significant discrete γ-ray emission is associated with Centaurus B. In addition, it seems to suggest that the gamma-ray emission is elongated in the direction of the radio lobes. To test this indication quantitatively, we compare the likelihood of the spectral fit using front and back data in the range 0.2−200 GeV for a point source and an elliptical shape compatible with the extent of the radio lobes (22′ × 10′ in size; see Fig. 2) with a uniform surface brightness. Here, a power-law function is similarly assumed to model the source spectrum with its normalization and index set free during the fitting procedure (see below). The improvement of TS in the case of the ellipse (ellipse1) with respect to the point-source case, TSext ≡ TSelp1 − TSpsc, is 2.4. Figure 2 also indicates an anisotropy of the gamma-ray emission. To test this, we rotate ellipse1 in 10° steps with its center fixed and fit the data for each case. The TS in the case of ellipse1 is the highest, and TS gradually drops with the rotation to a minimum in the case of the ellipse (ellipse2), which is rotated by 90° from ellipse1. The difference between the corresponding values of TS is TSrot ≡ TSelp1 − TSelp2 = 1.4. To test the significance of these improvements, we simulate 1000 front and back datasets in 0.2−200 GeV for the same time period as that of the observation by gtobssim in the Science Tools analysis package1, using a model where a point source for Centaurus B, the Galactic diffuse emission, and the isotropic backgrounds are included. The point source is set at the best-fit location and has the spectral shape of a power-law function (see below). All components in the model are set at the best-fit values in the range 0.2−200 GeV (see Sect. 2.2). Each simulated dataset is fitted with models that include Centaurus B, the Galactic diffuse emission, and the isotropic backgrounds. The normalization of all components and the index of Centaurus B are set free. We compare TS between cases where the spatial shape of Centaurus B is the point source, ellipse1, or ellipse2. We note that the position of the point source is fixed at the position estimated by using >1 GeV front data for each simulated dataset (i.e., the same estimation as that for the observed data). The results show that the probability for obtaining TSext ≥ 2.4 and TSrot ≥ 1.4 at once is 3%. This indicates a weak hint of the spatial elongation along the radio lobes in the γ-ray band, although we can not significantly confirm it. Data that will be accumulated in the coming years of the Fermi mission will provide us with better spatial information to discuss its extent in more detail.
We estimate the position of the γ-ray source to be (α, δ) = ( ,
,  ), following the localization of the highest TS (TSmax = 23) in the TS map (Fig. 2). The positional errors at 68% and 95% confidence levels are about 0
 06 and 011, which are delineated by contours of decrements of TS from TSmax by amounts of 2.3 and 6.0, respectively (Mattox et al. 1996). The estimated position with the 68% error contour is consistent with the position of 2FGL J1346.6 − 6027 at (α, δ) = (
 ,
,  ) and contains the core of Centaurus B at (α, δ) = (
 ,
,  ) (Jones et al. 2001). At the estimated position, TS is 29 using front and back data in the range 0.2 − 200 GeV, corresponding to a 4.5σ detection. The TS value is lower than in the 2FGL catalog (TS ~ 39 for 0.1 − 100 GeV), despite the longer integration time here. As we show in Sect. 2.2, the source is not significantly variable, although its measured flux was greatest in the first half of the time interval analyzed here, which overlaps most of the two-year interval analyzed for the 2FGL catalog. In addition, the likelihood analysis for the 2FGL catalog treated front and back events separately, which increased the sensitivity and TS values slightly. Hereafter, the γ-ray source associated with Centaurus B is analyzed as a point source with this estimated position.
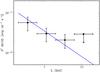 |
Fig. 3 Fermi-LAT spectrum of the Centaurus B source. The error bar indicates statistical errors of 1σ. The arrow represents the upper limit on the flux at 95% confidence level. The blue line represents the best-fit power-law function from a binned likelihood fit in the 0.2 − 200 GeV range. |
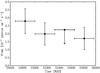 |
Fig. 4 Fermi-LAT light curve of the Centaurus B source in the photon energy range of 0.2 − 200 GeV. The error bar indicates statistical errors of 1σ, and the arrow represents the upper limit on the flux at 95% confidence level. |
2.2. Spectrum and time variability
Figure 3 shows the spectrum of the source associated with Centaurus B using front and back events. The spectral energy distribution (SED) is obtained by dividing the 0.2 − 20 GeV energy band into four energy bins. The indices of the other sources are fixed at the values given in the 2FGL catalog. The Centaurus B source is fitted with a simple power-law function in each energy bin with the photon index fixed at 2.6, the value obtained from a broad-band fitting over the larger 0.2 − 200 GeV energy range (see below). In each fit, all the sources within the ROI as well as the diffuse components in the model are fitted with their normalizations set free.
Log of Suzaku observations.
We tested a possible spectral steepening at the highest photon energies by performing likelihood-ratio tests between a power-law (the null hypothesis) and a log parabola function (the alternative hypothesis) for the 0.2−200 GeV data. The resulting TS is TSLP = −2ln(LPL/LLP) = 0.0, which means no significant curvature is present in the spectrum. The parameters obtained with the power-law model are the photon index Γγ = 2.6 ± 0.2 and the integrated 0.2 − 200 GeV flux of (1.9 ± 0.5) × 10-8 photon cm-2 s-1. We note that the uncertainties of the effective area translate to uncertainties in the flux of ≲10% and ≲ 0.1 for the index (Ackermann et al. 2012). The best-fit power-law function is represented as a blue line in Fig. 3. We note that the flux and index obtained in the likelihood analysis change negligibly if the position of 2FGL J1346.6-6027 or the Centaurus B core is used instead for the Centaurus B source.
Figure 4 shows the light curve of the Centaurus B source using front and back data in the 0.2−200 GeV range. We divide the whole LAT observation period (about 43 months) into only four bins, given the low flux of the source. In each time bin, the flux of the source is evaluated by performing gtlike with the Galactic diffuse and isotropic components fixed to the best-fit values obtained for the whole time range and the photon index fixed at the value 2.6 obtained from a broad-band fitting for the range 0.2 − 200 GeV. To test the variability quantitatively, we calculate each value of the log likelihood and sum them (ln(Li); the alternative hypothesis). We also calculate the log likelihood obtained from the fitting for the whole period (ln(Lconst); the null hypothesis). Then, TSvar = −2ln(Lconst/Li) is distributed as χ2 with three degrees of freedom (Nolan et al. 2012), and we obtain χ2/d.o.f. = 0.95. The probability for obtaining a value χ2/d.o.f. ≥ 0.95 with three degrees of freedom is ~40%, which means that there is no indication for variability of Centaurus B at γ-rays for the period spanned by the Fermi-LAT observations.
3. Suzaku data
We observed Centaurus B with the Suzaku X-ray satellite (Mitsuda et al. 2007) on 2011 July 16 − 18 (Observation ID 806017010). The nominal pointing position was set to the core of the radio galaxy. Since the main goal of the analysis is to search for the diffuse X-ray emission from the radio lobes, we focus here on the data taken with the X-ray Imaging Spectrometer (XIS; Koyama et al. 2007), which consists of four CCD sensors, each placed on the focal plane of the X-ray Telescope (XRT: Serlemitsos et al. 2007). Currently two front-illuminated CCDs (XIS0 and XIS3) and one back-illuminated CCD (XIS1) are operational, and the observation was performed with all the XIS sensors set to full-window and normal clocking modes. In this paper, we present the results obtained with XIS0 and XIS3 (hereafter FI). This is because the injection charge amount has been changed from 2 keV to 6 keV for the BI sensor on 2011 June 1, and the current non-X-ray background (NXB) estimation for XIS1 using xisnxbgen does not reproduce accurately the actual level of NXB2. In the spectral analysis, we also ignore the data between 1.8 and 2.0 keV, because there exists a calibration uncertainty around the Si-K edge3.
Since the radio lobes of Centaurus B are extended over almost the whole Suzaku CCD chip, it is difficult to extract background information from the data. Hence, we also analyze the Suzaku data for 4U 1344-60 (Observation ID 705058010; see also Svoboda et al. 2012), which is located ~14′ away from Centaurus B. We assume that the diffuse X-ray backgrounds are the same between these data given the proximity. This observation was performed on 2011 January 11 − 14 with full-window and normal clocking modes.
The screening criteria of XIS data are as follows. We utilized events with GRADE 0, 2, 3, 4 and 6, then removed flickering pixels by using cleansis. Good-time intervals were selected by the same criteria as described in The Suzaku Data Reduction Guide4, namely “SAA_HXD = = 0 T_SAA_HXD > 436 ELV > 5 DYE_ELV > 20 ANG_DIST < 1.5 S0_DTRATE < 3 AOCU_HK_CNT3_NML_P == 1”. In the screening and the following analysis, we used the HEASoft5 version 6.11 and calibration database (CALDB)6 released on 2012 February 11. The observation log and net exposures after the event screenings are summarized in Table 1.
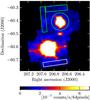 |
Fig. 5 Suzaku FI image (2 − 10 keV) of Centaurus B. The upper bright point-like source is the nucleus of the Centaurus B, and the lower source is 4U 1344 − 60. Green circle denotes the source-extracted region for the Centaurus B core. Two green rectangles on the same CCD indicate the background regions. The diffuse X-ray background spectrum was produced from events within the lower white rectangular region. |
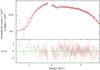 |
Fig. 6 Suzaku/XIS spectrum of the Centaurus B core. XIS0 and XIS3 spectra are shown in black and red, respectively. |
Best-fit model parameters for the core of Centaurus B and the source N.
Best-fit parameters for the diffuse X-ray background spectrum derived from blank sky around 4U 1344−60.
3.1. Core
Figure 5 shows the FI image in the 2 − 10 keV band after subtracting the NXB and correcting for vignetting and exposure. We extracted the events in a circular region with a radius of 4′ centered at the Centaurus B core position and produced the XIS spectrum shown in Fig. 6. The background region was selected from blank sky within the field of view (see Fig. 5). Response and ancillary response files were generated by xisrmfgen and xissimarfgen, respectively. Then, we fitted the 0.6 − 9.0 keV data with an absorbed power-law model (wabs*powerlaw) in XSPEC. The best-fit parameters are summarized in Table 2.
3.2. Diffuse background
A spectral analysis of faint diffuse emission requires the precise evaluation of the X-ray background emission. We extracted the background spectrum using the blank field of 4U 1344 − 60 (the 11′ × 2′ rectangular region shown in Fig. 5). Here we consider contamination from 4U 1344 − 60 given a relatively large PSF (~2′) of Suzaku XRT. The FI count rate of the contamination simulated by xissim (Ishisaki et al. 2007) was 0.0023 cts s-1 in the 0.5 − 7.0 keV range, while the measured count rate was 0.0114 cts s-1. We thus found that about 20% of the X-ray events within the considered rectangle are contaminated by 4U 1344 − 60. We note that we analyzed 14 ks Swift/XRT archival data and confirmed that there are no point sources in the rectangular region. We derived the 95% confidence level upper limit for the unabsorbed flux of 1.1 × 10⁻¹³ erg cm-2 s-1 at 0.5 − 10 keV, assuming a single power law with index 2.0 and NH = 1.05 × 1022 cm-2.
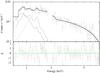 |
Fig. 7 Suzaku/XIS FI spectrum of the X-ray background obtained from blank sky near 4U 1344 − 60. Dashed, dot-dashed, and dotted lines represent the components of the Local Hot Bubble, the Galactic halo, and the CXB, respectively. |
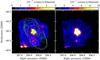 |
Fig. 8 (Left) Suzaku FI 0.5 − 2 keV image of Centaurus B. (Right) Suzaku FI 2 − 10 keV image of Centaurus B. The central bright source is the nucleus of the system. Green contours denote the 843 MHz radio intensity obtained from McAdam (1991). Magenta ellipse in the image denotes the source-extracted region for the lobes. The three magenta circular regions containing X-ray point sources are excluded from the analysis of the emission from the lobes. |
The diffuse X-ray background consists of three components: thermal emission from the Local Hot Bubble, a thermal component due to the Galactic halo, and a power-law component originating from a superposition of unresolved AGNs (“cosmic X-ray background”, CXB). After subtracting both the NXB estimated with xisnxbgen and the contaminant of 4U 1344 − 60, we fitted the background data in the 0.6 − 8.0 keV range with a model of mekal+wabs*(mekal+powerlaw) (see, e.g., Yuasa et al. 2009). In the fit, the absorption column density was fixed to the value in that direction7 (NH = 1.06 × 1022 cm-2). The value of NH obtained in the spectral analysis of the core is larger than this value, possibly due to the absorption of the host galaxy. The best-fit spectra and parameters are shown in Fig. 7 and Table 3, respectively. The derived power-law index does not agree with the “standard” CXB index of 1.41, but is similar to that of the Galactic ridge emission (index ~ 2.1, see e.g., Revnivtsev et al. 2006). This could be explained by the fact that the analyzed field is located close to the Galactic plane.
3.3. Lobes
We found two faint point sources within the radio contours of the lobes of Centaurus B in the 0.5−2 keV and 2−10 keV Suzaku FI NXB-subtracted exposure-corrected images (see Fig. 8). After masking the core and these two X-ray sources with 4′ and 2′ radii circles, the elliptical region (22′ × 10′ in size) was extracted for the spectral analysis of the lobes. The NXB was estimated with xisnxbgen. The contamination from the Centaurus B core was simulated by xissim, where the values in Table 2 were used for the spectra of the core. The spectrum of diffuse X-ray background of this region was simulated with XSPEC by using the values tabulated in Table 3. Figure 9 shows the observed spectrum together with the three background components. We utilized xissimarfgen to produce the ancillary response file assuming a uniform surface brightness in the elliptical region.
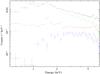 |
Fig. 9 Suzaku/XIS FI spectrum of the Centaurus B lobe region. The observed spectrum are shown in black. Green, red, and blue spectra denote the background components: the diffuse X-ray background, the NXB, and the contaminant from the core, respectively. |
Since the X-ray events of the diffuse background emission within the selected background region are small, statistical errors of the derived parameters are relatively large (see Table 3). In particular, the error in the normalization of the power-law component of the X-ray background significantly affects the evaluation of the faint diffuse X-ray emission from the radio lobes. As shown in Table 3, the ~25% statistical error in normalization dominates the ~3% systematic error in the estimation of NXB spectrum (Tawa et al. 2008) up to about 6 keV (see Fig. 7). Hence, we increased/decreased the normalization of the power-law component by 25% and produced a faked X-ray background spectrum. After subtracting it, we searched for the residual emission above 2 keV. When we increased the normalization by 25%, the residual spectrum did not show a significant power-law component and the best-fit normalization corresponded to zero (ΓX = 1.7 is assumed following the radio data; see Sect. 4). To derive the upper limit for the lobe X-ray emission, we considered the most conservative case, namely, the normalization of the power-law component of X-ray background decreased by 25%. Then we fitted the residual spectrum by assuming an absorbed power-law shape with only normalization set free and the other parameters fixed as ΓX = 1.7 and NH = 1.06 × 1022 cm-29. The obtained 90% confidence level upper limit for the unabsorbed 2 − 10 keV emission of the Centaurus B lobes is < 8.7 × 10⁻¹³ erg cm-2 s-1.
As shown in Fig. 8, one of the masked sources (source N), located at (α, δ) = ( ,
,  ), has a hard X-ray spectrum. This source is positionally coincident with the diffuse-like emission seen in the ASCA GIS 1.5 − 3.0 keV image within the southwestern radio lobe (see Fig. 3 in Tashiro et al. 1998). To derive spectral parameters of the source N, we extracted a circular region with a radius of 1′ centered at this source and produced an FI spectrum as shown in Fig. 10. The background region was selected from the blank field of the same CCD chip. The spectrum was well represented by the absorbed power-law model, as shown in Table 2. We also searched for possible counterparts of source N in other wavelengths using SIMBAD8 and found an infrared source just at the position of source N. This coincidence again supports the possibility that the point-like X-ray emission is unrelated to the radio lobe.
4. Radio data
An 843 MHz image (McAdam 1991) from the Molonglo Observatory Synthesis Telescope (MOST), with 43′′ resolution and excellent surface brightness sensitivity provides a reliable total integrated flux density of ~150 Jy. The northeastern lobe is substantially brighter with an integrated flux of ~93 Jy while the southwestern lobe contains ~57 Jy. Jones et al. (2001) used integrated flux densities from the literature, ranging from 30 MHz to 5 GHz, to derive a radio spectral index of α = 0.73. As noted in Sect. 1, the 1.4 GHz radio power puts Centaurus B near the boundary of the FR I/FR II luminosity division. The bright jet and diffuse lobe emission resembles the morphology of an FR I radio source, while the northeastern lobe has a sharp edge reminiscent of an FR II radio galaxy (see in this context Gopal-Krishna & Wiita 2000; Laing et al. 2011).
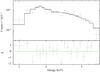 |
Fig. 10 Suzaku/XIS FI spectrum of the source N. |
Jones et al. (2001) also present observations of the entire source using the Australian Telescope Compact Array (ATCA) at 4.8 and 8.6 GHz. We are unable to obtain reliable integrated flux densities for the lobes from these images because of the large angular extent of the source (≃24′). A substantial amount of flux is lost, since the shortest baseline between antennas (~20 m for mosaicked images from the ATCA) is too large to recover the emission on the largest spatial scales. The entire source has also been imaged at 20 GHz (Burke-Spolaor et al. 2009). Again, the integrated fluxes cannot be used in our SED modeling due to the missing short spacings, although the results provide an accurate representation of the core, jet, and hotspot structures. Also, in this particular case, potential imaging artifacts due to the bright core may contaminate the faint lobe emission at 20 GHz.
Since our line of sight to the source passes within 1.7° of the Galactic plane, single dish measurements can be contaminated by the Galactic emission (particularly at low radio frequencies). The Parkes-MIT-NRAO survey conducted at 4.8 GHz (Condon et al. 1993) provides us with a second suitable image for extraction of integrated fluxes. The Parkes 64 m dish image has high enough angular resolution (~5′) to resolve the source into two lobes, with integrated flux densities of ≃ 29 Jy and ≃ 18 Jy for the northeastern and southwestern lobes, respectively. Furthermore, the observing frequency is also high enough, at this spatial resolution, to avoid any substantial contamination from diffuse Galactic emission. The core and inner jet flux contributes ~3 Jy at 5 GHz (Marshall et al. 2005), which is a small fraction of the total integrated emission of ~47 Jy. Since the lobes are brighter at lower frequencies, the contribution from the core becomes negligible at frequencies below 5 GHz. Hence, the integrated fluxes from 30 MHz to 5 GHz provide accurate representations of the integrated emission from the lobes.
The newly launched Planck satellite (Planck Collaboration 2011a) has observed the sky in nine frequency bands from 30 − 857 GHz with the first all-sky compact-source catalog of high-reliability sources presented in Planck Collaboration (2011b). They used detailed source extraction algorithms to reliably detect discrete sources immersed in a diffuse foreground (e.g., the Galactic plane). From their catalog, we were able to extract integrated fluxes for Centaurus B at 30, 44, 70, 100, and 143 GHz. The spatial resolution of 33′ at 30 GHz means that Centaurus B is unresolved and the total flux density accurately represents the entire flux (lobes plus core) from the source at this frequency. We cannot discriminate between the contribution of the core and lobe fluxes from the available data at higher radio frequencies; however, we expect the flat-spectrum core to become increasingly dominant over the steep-spectrum lobes above 30 GHz. The extracted 44 GHz flux density appears to slightly underestimate the total flux of the source at this frequency (based on power-law fit to all Planck data points), even though the spatial resolution of 27′ should be sufficient to include the entire emission from the source. The spatial resolution of Planck at 70, 100, and 143 GHz of 13′, 10′, and 7′ means that a large fraction of the flux from the lobes of Centaurus B is missing.
5. Discussion
The observed GeV emission of Centaurus B could be produced within the unresolved core of the system, in the analogy to some other radio galaxies detected by the Fermi-LAT, such as NGC 1275 (Abdo et al. 2009a; Kataoka et al. 2010), M 87 (Abdo et al. 2009b; Abramowski et al. 2012), 3C 120, or 3C 111 (Kataoka et al. 2011). In those cases, the broad-band nuclear spectra as well as the established γ-ray variabilities indicate that the γ-ray production is dominated by the inner (pc/sub-pc scale) relativistic jets observed at intermediate viewing angles (“misaligned blazars”). The jet/counterjet radio brightness and polarization asymmetries on slightly larger scales in the source studied here imply intermediate jet inclinations and relativistic beaming involved, supporting the idea that the nucleus may contribute to the observed γ-ray emission, at least at some level. On the other hand, the LAT analysis of Centaurus B provides a weak hint of the spatial extension of the γ-ray counterpart and no indication of significant flux variability in the GeV range, which suggests that the extended (100-kpc scale) lobes in the system could be considered as a promising emission site of the high-energy photons as well. The arguments based on the morphology of the analyzed γ-ray emitter and its timing properties are nonetheless rather weak, due to the limited photon statistics.
At X-ray frequencies, the core of Centaurus B appears as a relatively bright source. In their analysis of the ASCA data, Tashiro et al. (1998) found the 2−10 keV nuclear unabsorbed flux of ≃ (6.4 ± 0.2) × 10-12 erg cm-2 s-1 with a power-law model of ΓX ≃ 1.64 ± 0.07 and NH ≃ (1.76 ± 0.11) × 1022 cm-2 possibly in excess over the Galactic value. This is in agreement with the Chandra snapshot obtained by Marshall et al. (2005), who measured the 1 keV nuclear flux  nJy and the best-fit power-law model with ΓX ≃ 1.63 ± 0.17. Our new Suzaku exposure confirms the previous studies, revealing the unabsorbed 2 − 10 keV flux of the core ≃ (5.1 ± 0.4) × 10-12 erg cm-2 s-1 marginally lower than that implied by the ASCA observations but consistent with that detected by XMM-Newton (Tashiro et al. 2005), with ΓX ≃ 1.62 ± 0.05 and NH ≃ (1.63 ± 0.08) × 1022 cm-2. The unabsorbed X-ray (2 − 10 keV) luminosity of the core, LX ≃ 2 × 1042 erg s-1, is roughly comparable to the γ-ray (0.2 − 200 GeV) luminosity of the Centaurus B system, Lγ ≃ 6 × 1042 erg s-1 (see Fig. 11). In addition, the inner parts of the main (SW) jet were resolved at arcsec scale with Chandra (Marshall et al. 2005). The detection of the SW jet on larger scales was also claimed in the preliminary analysis of the XMM data (Tashiro et al. 2005). If the observed X-ray continuum of the nucleus corresponds to the beamed non-thermal (inverse-Compton) emission of the unresolved jet, the observed γ-ray flux could be explained well as a high-energy tail of the same nuclear emission component.
A caveat is that in radio galaxies the observed X-ray nuclear emission is typically dominated by the accretion disks and disk coronae, and not by the misaligned unresolved jets. This seems to be particularly robust in the case of powerful objects accreting at high rates, like Broad-Line Radio Galaxies (e.g., Eracleous et al. 2000; Kataoka et al. 2011). For low-power objects accreting at low rates, such as FR I radio galaxies, their entire observed X-ray continua may be due to the innermost parts of the jets (Donato et al. 2004; Evans et al. 2006; Hardcastle et al. 2009b). This controversy relates in particular to low-power radio galaxies detected by the Fermi-LAT (see the discussion in Abdo et al. 2009a,b, 2010a, and references therein). Centaurus B seems to be an intermediate case between low- and high-power sources, and hence one may expect a mixture of the nuclear-jet and accretion-related emission components at X-ray frequencies. The observed spectral properties of the X-ray core in the system suggest, however, a dominant contribution from the jet.
In order to test the hypothesis that the observed γ-ray emission of Centaurus B originates in the innermost parts of a misaligned relativistic jet, we apply the synchrotron self-Compton (SSC) model to the collected broad-band data of the unresolved core in the system9, assuming that the emission site can be approximated as a homogeneous spherical region with radius R′, filled uniformly with tangled magnetic field and radiating electrons. This is the first time that the SSC model is applied to the misaligned relativistic jet in Centaurus B and compared with the compiled multiwavelength dataset for the unresolved core. As shown in Fig. 11, the model successfully explains the data for the following parameters: jet radius R′ = 0.03 pc, jet magnetic field B = 0.095 G, and jet Doppler factor δ = 2. For the radiating electrons, we assume a power-law energy spectrum  , where γ is the Lorentz factor, between energies γmin = 30 and γbr = 2 × 10³, breaking to
  above γbr and continuing as such up to γmax = 105. The fit requires normalization of the energy spectrum such that the ratio of the comoving electron and magnetic energy densities is
 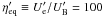 . All these parameters are broadly consistent with the ones inferred for the cores of other GeV-detected radio galaxies (see Abdo et al. 2009a,b, 2010a). Also, the jet power emerging from the model presented here should be considered as reasonable: assuming no significant jet radial structure, the model value of the jet Doppler factor δ = 2 implies jet bulk Lorentz factors Γj = 4 − 7 for the jet viewing angles within the range θj = 20° − 25°, and hence the jet luminosity, roughly,
  erg s-1. This estimate neglects likely contribution of protons to the jet kinetic flux, and therefore should be considered as a lower limit only. The implied jet-counterjet brightness asymmetry, R ≡ [(1 + βjcosθj)/(1 − βjcosθj)] ε = (2Γjδ − 1)ε, where
  is the jet bulk velocity and ε = 2 + α assuming a steady jet and the emission spectral index α, is on the other hand rather high, R ≳ 103 for α ≳ 0.5, much greater than the one measured on larger scales (Jones et al. 2001). This is, however, consistent with the established idea of the jet deceleration from sub-pc to kpc scales – the process inevitably accompanied by the formation of radial stratification of the jet – in low- and intermediate-power radio galaxies (FR Is and FR I/FR IIs), such as Centaurus B (see in this context, e.g., Laing et al. 1999; Laing & Bridle 2002).
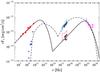 |
Fig. 11 Broad-band SEDs of Centaurus B and the model curves for the emission of the extended lobes and core in the system. Red circles denote the total radio fluxes within the range 30 MHz−5 GHz (Jones et al. 2001, and references therein) and at 30 GHz measured by Planck. The radio fluxes for the unresolved core, plotted as blue stars, are taken from Jones et al. (2001), Fey et al. (2004) and Burke-Spolaor et al. (2009). The ASCA measurements of the lobes’ and core spectra within the range 0.7−10 keV, as discussed in Tashiro et al. (1998), are denoted by red and blue bow ties, respectively. The Chandra 0.5−7 keV spectrum of the unresolved core is given by cyan bow tie following Marshall et al. (2005). The Fermi-LAT fluxes represented by magenta squares correspond to the analysis presented in Sect. 2 of this paper. The black bow tie denotes the 2−10 keV emission of the nucleus emerging from the analysis of our Suzaku data, while the thick black line shows the 2−10 keV Suzaku upper limit for the lobes’ emission (see Sect. 3). Thick gray curves denote the broad-band emission of the lobes modeled in the framework of the synchrotron and inverse-Compton scenario, while a black dashed curve corresponds to the SSC model of the unresolved core in the system, as discussed in Sect. 5. |
Let us now focus on the extended lobes in the Centaurus B system. For modeling the broad-band SED of the lobes, we use the the total radio fluxes in the range 30 MHz − 5 GHz as provided by Jones et al. (2001), as well as the 30 GHz flux measured by Planck, which should represent the integrated emission of the lobes (see Sect. 4). We also take into account the X-ray upper limit of our Suzaku observations, F2 − 10 keV < 8.7 × 10⁻¹³ erg cm-2 s-1 assuming ΓX = 1.7 as shown in Sect. 3. We note that this upper limit is only marginally consistent with the flux found by Tashiro et al. (1998), F2 − 10 keV ≃ (9.8 ± 3.8) × 10-13 erg cm-2 s-1. We assume that the radio emission is due to the synchrotron radiation of non-thermal electrons distributed isotropically within the homogeneous lobes. We approximate the lobes for simplicity as two spheres with radii R ≃ 100 kpc, so that the total volume of the emission region is Vℓ ≃ 2 × (4π/3)R3. The high-energy continuum, on the other hand, including the X-ray and γ-ray fluxes, is ascribed to the inverse-Compton (IC) emission of the same electron population. As in the case of Centaurus A (Abdo et al. 2010b), we consider three relevant target photon fields: the CMB, the extragalactic background light (EBL) photons within the infrared-to-optical range, and the starlight of the host galaxy. In our calculations, we use the EBL model of Raue & Mazin (2008), and note that this particular choice does not affect the obtained results. For the starlight of the host galaxy, we use a template for the giant elliptical normalized to the 1.4 × 10¹⁴ Hz flux of extinction-corrected flux of 0.42 Jy (Laustsen et al. 1977; Schröder et al. 2007). This gives a V-band luminosity for the host of LV ≃ 1044 erg s-1, and the corresponding energy density of the starlight within the lobes Ustar ≃ Lstar/4πR2c ~ 3LV/4πR2c ≲ 10-14 erg cm-3. The results of the modeling are presented in Fig. 11.
As shown in Fig. 11, the simplified model can explain the radio and γ-ray fluxes well, not violating the X-ray upper limit. For the model parameters, the IC spectrum is dominated by the CMB component, with negligible contribution from the EBL and the starlight of the host galaxy. A broken power-law electron energy distribution dNe/dγ is set to ∝ γ-2.4 for γ < γbr and dNe/dγ ∝ γ-3.4 for γ > γbr, with minimum, break, and maximum Lorentz factors of γmin = 1, γbr = 3.5 × 10⁵, and γmax = 1.5 × 10⁶, respectively. The lobes appear to be slightly out of the energy equipartition, with the corresponding electron-to-magnetic field energy density ratio ηeq ≡ Ue/UB ≃ 4 and the magnetic field intensity B ≃ 3.5 μG (see in this context Tashiro et al. 1998; Kataoka & Stawarz 2005; Croston et al. 2005; Isobe et al. 2011).The lobe pressure stored in ultrarelativistic electrons and magnetic field is pe + B ≃ 8 × 10-13 dyn cm-2, while the total energy injected by the jets over the source lifetime (a sum of the work done in displacing a volume Vℓ of surrounding gas at pressure pe + B and the energy of the material inside the cavity) is Etot ≃ 4 pe + B Vℓ ~ 8 × 1059 erg. These values, derived from the crude approximations in the modeling, are typical for intermediate-power radio galaxies (see, e.g., Croston et al. 2005; Bîrzan et al. 2008; Isobe et al. 2009).
It can be seen from Fig. 11 that the model fit depends crucially on the high-energy tail of the electron energy distribution within the lobes, which is currently unconstrained by the data. To account for the Fermi-LAT fluxes, the electron break Lorentz factors within the lobes must be as high as γbr = 3.5 × 10⁵, giving the expected break synchrotron frequency νbr ≃ 1.8 × 10¹² Hz for B ≃ 3.5 μG. This would then correspond to the spectral age of the lobes  (1)according to the standard synchrotron aging theory (see, e.g., Konar et al. 2006; Machalski et al. 2007). This is a rather young age for the observed ~ 400 kpc extension of the entire radio structure, implying either particularly high advance velocity of the jets in the system, vadv ≳ 0.1 c, for the dynamical age τdyn ~ 2R/vadv to be comparable with τrad, or efficient re-acceleration of ultrarelativistic particles stored within the lobes. Such a re-acceleration process (the exact nature of which we do not specify) would result in a younger spectral appearance of the lobes. In this case, the age derived based on the spectral analysis, τrad ~ 3 Myr, could be much shorter than the true age of the system, namely, τdyn ~ 2R/vadv > 10 Myr with the jet advance velocities vadv < 0.1 c, which are typically derived for the evolved radio galaxies (linear sizes > 10 kpc; see the discussions in Scheuer 1995; Alexander 2000; Machalski et al. 2007; Kawakatu et al. 2008).
Here we favor the re-acceleration scenario, since the alternative explanation involves uncomfortably high values of vadv ~ 0.1 c, exceeding by orders of magnitude the sound velocity in the surrounding medium  (with the expected T ~ 107 K). This would imply the presence of a strong bow-shock driven in the ambient medium by the supersonically expanding lobes, with the Mach number ℳ = vadv/cs ≫ 10 unprecedentedly high for an evolved radio galaxy. We emphasize that all the bow-shocks discovered till now in such systems are characterized by very low Mach numbers, typically ℳ ~ 2 (see Siemiginowska et al. 2012, and references therein), with the prominent exception of the ℳ ≃ 8 shock detected around the southern inner lobe in the Centaurus A system, albeit on much smaller (kpc) scales (Croston et al. 2009). We also note that similar conclusions regarding particle re-acceleration in the extended lobes have been presented in the case of two other radio galaxies resolved by the Fermi-LAT, Centaurus A (Abdo et al. 2010b) and NGC 6251 (Takeuchi et al. 2012). Clearly, high-frequency ( > 30 GHz) radio observations by ground-based interferometers with the appropriate resolution and sufficiently short baselines are required to make further robust statements in this respect, since the association of the γ-ray emission site in Centaurus B could be confirmed further by constraining the high-energy tail of the lobes’ synchrotron continuum.
It is also important to determine the level of the diffuse non-thermal X-ray emission in Centaurus B by ultra-deep exposures with modern X-ray telescopes. If the diffuse non-thermal X-ray emission is significantly below the upper limits derived in this paper, then the association of the γ-ray emitter with the radio lobes should be viewed as unlikely. Such a low level of the X-ray non-thermal halo would imply that the lobes are dominated by magnetic pressure, contrary to previous claims presented in the literature, or at least ηeq ≃ 1. This is because the X-ray-to-radio luminosity ratio is determined by the magnetic field energy density (or pressure) within the lobes, LX/LR = Ucmb/UB ∝ B-2, where Ucmb is the energy density of the CMB photon field. The lower X-ray flux for a given radio flux implies a lower value of the ηeq parameter. In particular, noting that the inverse-Compton X-ray luminosity LX ∝ Ucmb × Ue ∝ ηeq UB, one may find  for the fixed LR and Ucmb. In the modeling presented above, the expected X-ray luminosity of the lobes is only a factor of ≃ 1.4 below the provided Suzaku upper limit, and the corresponding equipartition parameter is ηeq = 4. On the other hand, if the X-ray flux is a factor of 3 below the current upper limit, the equipartition parameter is ηeq < 1 and magnetic pressure dominates over the pressure of ultrarelativistic electrons within the lobes of Centaurus B.
6. Conclusions
In this paper, we present a detailed analysis of about 43 months’ accumulation of Fermi-LAT data and of newly acquired Suzaku X-ray data for Centaurus B. We detect the source in GeV photon energies at 4.5σ significance (TS = 29). The implied γ-ray (0.2−200 GeV) luminosity of the system is Lγ ≃ 6 × 1042 erg s-1, and the observed continuum within the LAT range is best modeled by a power-law function with the photon index Γγ = 2.6 ± 0.2. At X-ray frequencies, we detect the core of Centaurus B with Suzaku at the flux level consistent with the previous measurements with ASCA, XMM-Newton, and Chandra. The unabsorbed 2−10 keV luminosity of the core is LX ≃ 2 × 1042 erg s-1, and the spectrum is best fitted with the power-law model with photon index ΓX ≃ 1.62 ± 0.05. We do not detect any significant diffuse X-ray emission of the lobes with the provided upper limit F2 − 10 keV < 8.7 × 10⁻¹³ erg cm-2 s-1, assuming the photon index ΓX = 1.7. The upper limit is marginally consistent with the flux found by Tashiro et al. (1998) in their analysis of the ASCA data, F2−10 keV ≃ (9.8 ± 3.8) × 10-13 erg cm-2 s-1.
By means of broad-band modeling, we show that the observed γ-ray flux of the source may in principle be produced within the lobes via the inverse-Compton scattering of the CMB photon field by radio-emitting electrons, if the diffuse non-thermal X-ray emission component is not significantly below the derived Suzaku upper limit. This association would imply efficient in-situ acceleration of ultrarelativistic particles within the lobes dominated by the particle pressure, in direct analogy to two other radio galaxies resolved by Fermi-LAT, namely, Centaurus A (Abdo et al. 2010b) and NGC 6251 (Takeuchi et al. 2012). However, if the diffuse X-ray emission in the studied object is much below the derived Suzaku upper limits, then the observed γ-ray flux is not likely to be produced within the lobes, but instead within the unresolved core of the Centaurus B radio galaxy. Assuming the one-zone synchrotron self-Compton model, we show that this possibility is also justified by the broad-band data collected for the unresolved core of Centaurus B, including the newly derived Suzaku spectrum and the expected parameters of the misaligned nuclear relativistic jet. Interestingly, in such a case the extended lobes in the system could be dominated by the pressure of the magnetic field.
Available at the Fermi Science Support Center, http://fermi.gsfc.nasa.gov/ssc
Because the observed core radio fluxes correspond to a superposition of different self-absorbed jet components, we consider these as upper limits for the emission of the modeled emission site, for which the rest-frame turnover frequency related to the synchrotron self-absorption (SSA) process reads as  GHz.
GHz.
Acknowledgments
We thank M. Ajello, S. W. Digel, J. Finke, and Y. Uchiyama for useful discussions. We also appreciate the referee for his/her valuable comments, which improved our paper. Y.T. and J.S. acknowledge the support from the Faculty of the European Space Astronomy Centre (ESAC). Ł.S. is grateful for the support from Polish MNiSW through the grant N-N203-380336. Work by C.C.C. at NRL is sponsored by NASA DPR S-15633-Y. The Fermi-LAT Collaboration acknowledges generous ongoing support from a number of agencies and institutes that have supported both the development and the operation of the LAT as well as scientific data analysis. These include the National Aeronautics and Space Administration and the Department of Energy in the United States, the Commissariat à l’Énergie Atomique and the Centre National de la Recherche Scientifique/Institut National de Physique Nucléaire et de Physique des Particules in France, the Agenzia Spaziale Italiana and the Istituto Nazionale di Fisica Nucleare in Italy, the Ministry of Education, Culture, Sports, Science and Technology (MEXT), High Energy Accelerator Research Organization (KEK), and Japan Aerospace Exploration Agency (JAXA) in Japan, and the K. A. Wallenberg Foundation, the Swedish Research Council, and the Swedish National Space Board in Sweden. Additional support for science analysis during the operations phase is gratefully acknowledged from the Istituto Nazionale di Astrofisica in Italy and the Centre National d’Études Spatiales in France.
References
- Abdo, A. A., Ackermann, M., Ajello, M., et al. 2009a, ApJ, 699, 31 [NASA ADS] [CrossRef] [Google Scholar]
- Abdo, A. A., Ackermann, M., Ajello, M., et al. 2009b, ApJ, 707, 55 [NASA ADS] [CrossRef] [Google Scholar]
- Abdo, A. A., Ackermann, M., Ajello, M., et al. 2010a, ApJ, 719, 1433 [NASA ADS] [CrossRef] [Google Scholar]
- Abdo, A. A., Ackermann, M., Ajello, M., et al. 2010b, Science, 328, 725 [NASA ADS] [CrossRef] [PubMed] [Google Scholar]
- Abdo, A. A., Ackermann, M., Ajello, M., et al. 2010c, ApJ, 720, 912 [NASA ADS] [CrossRef] [Google Scholar]
- Abraham, J., Abreu, P., Aglietta, M., et al. 2007, Science, 318, 938 [NASA ADS] [CrossRef] [PubMed] [Google Scholar]
- Abramowski, A., Acero, F., Aharonian, F., et al. 2012, ApJ, 746, 151 [NASA ADS] [CrossRef] [Google Scholar]
- Ackermann, M., Ajello, M., Allafort, A., et al. 2011, ApJ, 743, 171 [NASA ADS] [CrossRef] [Google Scholar]
- Ackermann, M., Ajello, M., Albert, A., et al. 2012, ApJS, 203, 4 [NASA ADS] [CrossRef] [Google Scholar]
- Alexander, P. 2000, MNRAS, 319, 8 [NASA ADS] [CrossRef] [Google Scholar]
- Atwood, W. B., Abdo, A. A., Ackermann, M., et al. 2009, ApJ, 697, 1071 [NASA ADS] [CrossRef] [Google Scholar]
- Bîrzan, L., McNamara, B. R., Nulsen, P. E. J., Carilli, C. L., & Wise, M. W. 2008, ApJ, 686, 859 [NASA ADS] [CrossRef] [Google Scholar]
- Burke-Spolaor, S., Ekers, R. D., Massardi, M., et al. 2009, MNRAS, 395, 504 [NASA ADS] [CrossRef] [Google Scholar]
- Condon, J. J., Griffith, M. R., & Wright, A. E. 1993, AJ, 106, 1095 [NASA ADS] [CrossRef] [Google Scholar]
- Croston, J. H., Hardcastle, M. J., Harris, D. E., et al. 2005, ApJ, 626, 733 [NASA ADS] [CrossRef] [Google Scholar]
- Croston, J. H., Kraft, R. P., Hardcastle, M. J., et al. 2009, MNRAS, 395, 1999 [NASA ADS] [CrossRef] [Google Scholar]
- Donato, D., Sambruna, R. M., & Gliozzi, M. 2004, ApJ, 617, 915 [NASA ADS] [CrossRef] [Google Scholar]
- Ebeling, H., Mullis, C. R., & Tully, R. B. 2002, ApJ, 580, 774 [NASA ADS] [CrossRef] [Google Scholar]
- Eracleous, M., Sambruna, R., & Mushotzky, R. F. 2000, ApJ, 537, 654 [NASA ADS] [CrossRef] [Google Scholar]
- Evans, D. A., Worrall, D. M., Hardcastle, M. J., Kraft, R. P., & Birkinshaw, M. 2006, ApJ, 642, 96 [NASA ADS] [CrossRef] [Google Scholar]
- Feigelson, E. D., Laurent-Muehleisen, S. A., Kollgaard, R. I., & Fomalont, E. B. 1995, ApJ, 449, L149 [Google Scholar]
- Fey, A. L., Ojha, R., Reynolds, J. E., et al. 2004, AJ, 128, 2593 [NASA ADS] [CrossRef] [Google Scholar]
- Gopal-Krishna, & Wiita, P. J. 2000, A&A, 363, 507 [NASA ADS] [Google Scholar]
- Hardcastle, M. J., Cheung, C. C., Feain, I. J., & Stawarz, Ł. 2009a, MNRAS, 393, 1041 [NASA ADS] [CrossRef] [Google Scholar]
- Hardcastle, M. J., Evans, D. A., & Croston, J. H. 2009b, MNRAS, 396, 1929 [NASA ADS] [CrossRef] [Google Scholar]
- Ishisaki, Y., Maeda, Y., Fujimoto, R., et al. 2007, PASJ, 59, 113 [NASA ADS] [Google Scholar]
- Isobe, N., Tashiro, M. S., Gandhi, P., et al. 2009, ApJ, 706, 454 [NASA ADS] [CrossRef] [Google Scholar]
- Isobe, N., Seta, H., & Tashiro, M. S. 2011, PASJ, 63, 947 [Google Scholar]
- Jones, P. A., Lloyd, B. D., & McAdam, W. B. 2001, MNRAS, 325, 817 [NASA ADS] [CrossRef] [Google Scholar]
- Kaneda, H., Tashiro, M., Ikebe, Y., et al. 1995, ApJ, 453, L13 [NASA ADS] [CrossRef] [Google Scholar]
- Kataoka, J., & Stawarz, Ł. 2005, ApJ, 622, 797 [NASA ADS] [CrossRef] [Google Scholar]
- Kataoka, J., Stawarz, Ł., Cheung, C. C., et al. 2010, ApJ, 715, 554 [NASA ADS] [CrossRef] [Google Scholar]
- Kataoka, J., Stawarz, Ł., Takahashi, Y., et al. 2011, ApJ, 740, 29 [NASA ADS] [CrossRef] [Google Scholar]
- Kawakatu, N., Nagai, H., & Kino, M. 2008, ApJ, 687, 141 [NASA ADS] [CrossRef] [Google Scholar]
- Konar, C., Saikia, D. J., Jamrozy, M., & Machalski, J. 2006, MNRAS, 372, 693 [NASA ADS] [CrossRef] [Google Scholar]
- Koyama, K., Tsunemi, H., Dotani, T., et al. 2007, PASJ, 59, 23 [Google Scholar]
- Kraan-Korteweg, R. C., & Lahav, O. 2000, A&A Rev., 10, 211 [NASA ADS] [CrossRef] [Google Scholar]
- Kraan-Korteweg, R. C., & Woudt, P. A. 1999, PASA, 16, 53 [NASA ADS] [CrossRef] [Google Scholar]
- Kraan-Korteweg, R. C., Ochoa, M., Woudt, P. A., & Andernach, H. 2005, in Nearby Large-Scale Structures and the Zone of Avoidance, eds. A. P. Fairall, & P. A. Woudt, ASP Conf. Ser., 329, 159 [Google Scholar]
- Laing, R. A., & Bridle, A. H. 2002, MNRAS, 336, 1161 [NASA ADS] [CrossRef] [Google Scholar]
- Laing, R. A., Parma, P., de Ruiter, H. R., & Fanti, R. 1999, MNRAS, 306, 513 [NASA ADS] [CrossRef] [Google Scholar]
- Laing, R. A., Guidetti, D., Bridle, A. H., Parma, P., & Bondi, M. 2011, MNRAS, 417, 2789 [NASA ADS] [CrossRef] [Google Scholar]
- Laustsen, S., Schuster, H.-E., & West, R. M. 1977, A&A, 59, L3 [NASA ADS] [Google Scholar]
- Lynden-Bell, D., Faber, S. M., Burstein, D., et al. 1988, ApJ, 326, 19 [NASA ADS] [CrossRef] [Google Scholar]
- Machalski, J., Chyży, K. T., Stawarz, Ł., & Kozieł, D. 2007, A&A, 462, 43 [NASA ADS] [CrossRef] [EDP Sciences] [Google Scholar]
- Marshall, H. L., Schwartz, D. A., Lovell, J. E. J., et al. 2005, ApJS, 156, 13 [NASA ADS] [CrossRef] [Google Scholar]
- Mattox, J. R., Bertsch, D. L., Chiang, J., et al. 1996, ApJ, 461, 396 [NASA ADS] [CrossRef] [Google Scholar]
- McAdam, W. B. 1991, Proc. Astron. Soc. Austr., 9, 255 [Google Scholar]
- Mitsuda, K., Bautz, M., Inoue, H., et al. 2007, PASJ, 59, 1 [Google Scholar]
- Moskalenko, I. V., Stawarz, Ł., Porter, T. A., & Cheung, C. C. 2009, ApJ, 693, 1261 [NASA ADS] [CrossRef] [Google Scholar]
- Nagar, N. M., & Matulich, J. 2008, A&A, 488, 879 [NASA ADS] [CrossRef] [EDP Sciences] [Google Scholar]
- Nagayama, T., Woudt, P. A., Nagashima, C., et al. 2004, MNRAS, 354, 980 [NASA ADS] [CrossRef] [Google Scholar]
- Nolan, P. L., Abdo, A. A., Ackermann, M., et al. 2012, ApJS, 199, 31 [NASA ADS] [CrossRef] [Google Scholar]
- O’Sullivan, S., Reville, B., & Taylor, A. M. 2009, MNRAS, 400, 248 [NASA ADS] [CrossRef] [Google Scholar]
- Pe’er, A., & Loeb, A. 2012, JCAP, 3, 7 [Google Scholar]
- Planck Collaboration 2011a, A&A, 536, A1 [NASA ADS] [CrossRef] [EDP Sciences] [Google Scholar]
- Planck Collaboration 2011b, A&A, 536, A7 [NASA ADS] [CrossRef] [EDP Sciences] [Google Scholar]
- Raue, M., & Mazin, D. 2008, Int. J. Mod. Phys. D, 17, 1515 [NASA ADS] [CrossRef] [Google Scholar]
- Revnivtsev, M., Sazonov, S., Gilfanov, M., Churazov, E., & Sunyaev, R. 2006, A&A, 452, 169 [NASA ADS] [CrossRef] [EDP Sciences] [Google Scholar]
- Scheuer, P. A. G. 1995, MNRAS, 277, 331 [NASA ADS] [Google Scholar]
- Schröder, A. C., Mamon, G. A., Kraan-Korteweg, R. C., & Woudt, P. A. 2007, A&A, 466, 481 [NASA ADS] [CrossRef] [EDP Sciences] [Google Scholar]
- Serlemitsos, P. J., Soong, Y., Chan, K.-W., et al. 2007, PASJ, 59, 9 [Google Scholar]
- Siemiginowska, A., Stawarz, Ł., Cheung, C. C., et al. 2012, ApJ, 750, 124 [NASA ADS] [CrossRef] [Google Scholar]
- Svoboda, J., Bianchi, S., Guainazzi, M., et al. 2012, A&A, 545, A148 [NASA ADS] [CrossRef] [EDP Sciences] [Google Scholar]
- Takeuchi, Y., Kataoka, J., Stawarz, L., et al. 2012, ApJ, 749, 66 [NASA ADS] [CrossRef] [Google Scholar]
- Tashiro, M., Kaneda, H., Makishima, K., et al. 1998, ApJ, 499, 713 [NASA ADS] [CrossRef] [Google Scholar]
- Tashiro, M., Isobe, N., Suzuki, M., et al. 2005, in X-Ray and Radio Connections, eds. L. O. Sjouwerman, & K. K. Dyer [Google Scholar]
- Tawa, N., Hayashida, K., Nagai, M., et al. 2008, PASJ, 60, 11 [Google Scholar]
- West, R. M., & Tarenghi, M. 1989, A&A, 223, 61 [NASA ADS] [Google Scholar]
- Yuasa, T., Nakazawa, K., & Makishima, K. 2009, PASJ, 61, 1107 [NASA ADS] [Google Scholar]
All Tables
Best-fit parameters for the diffuse X-ray background spectrum derived from blank sky around 4U 1344−60.
All Figures
|
Fig. 1 (Left) Fermi-LAT count map using front events above 1 GeV around Centaurus B in units of counts per pixel. The pixel size is |
| In the text | |
|
Fig. 2 Fermi-LAT TS map obtained with a maximum likelihood analysis using front events above 1 GeV in the vicinity of Centaurus B. Linear green contours of the 843 MHz radio map are overlaid (McAdam 1991). The blue ellipse compatible with the radio lobes is also shown. Black cross and contours represent the estimated position and the positional errors at 68% and 95% confidence levels in this analysis, respectively. Magenta cross and ellipses represent the position and the errors at 68% and 95% confidence levels of 2FGL J1346.6 − 6027. The position of the core of Centaurus B is represented as a diamond. |
| In the text | |
|
Fig. 3 Fermi-LAT spectrum of the Centaurus B source. The error bar indicates statistical errors of 1σ. The arrow represents the upper limit on the flux at 95% confidence level. The blue line represents the best-fit power-law function from a binned likelihood fit in the 0.2 − 200 GeV range. |
| In the text | |
|
Fig. 4 Fermi-LAT light curve of the Centaurus B source in the photon energy range of 0.2 − 200 GeV. The error bar indicates statistical errors of 1σ, and the arrow represents the upper limit on the flux at 95% confidence level. |
| In the text | |
|
Fig. 5 Suzaku FI image (2 − 10 keV) of Centaurus B. The upper bright point-like source is the nucleus of the Centaurus B, and the lower source is 4U 1344 − 60. Green circle denotes the source-extracted region for the Centaurus B core. Two green rectangles on the same CCD indicate the background regions. The diffuse X-ray background spectrum was produced from events within the lower white rectangular region. |
| In the text | |
|
Fig. 6 Suzaku/XIS spectrum of the Centaurus B core. XIS0 and XIS3 spectra are shown in black and red, respectively. |
| In the text | |
|
Fig. 7 Suzaku/XIS FI spectrum of the X-ray background obtained from blank sky near 4U 1344 − 60. Dashed, dot-dashed, and dotted lines represent the components of the Local Hot Bubble, the Galactic halo, and the CXB, respectively. |
| In the text | |
|
Fig. 8 (Left) Suzaku FI 0.5 − 2 keV image of Centaurus B. (Right) Suzaku FI 2 − 10 keV image of Centaurus B. The central bright source is the nucleus of the system. Green contours denote the 843 MHz radio intensity obtained from McAdam (1991). Magenta ellipse in the image denotes the source-extracted region for the lobes. The three magenta circular regions containing X-ray point sources are excluded from the analysis of the emission from the lobes. |
| In the text | |
|
Fig. 9 Suzaku/XIS FI spectrum of the Centaurus B lobe region. The observed spectrum are shown in black. Green, red, and blue spectra denote the background components: the diffuse X-ray background, the NXB, and the contaminant from the core, respectively. |
| In the text | |
|
Fig. 10 Suzaku/XIS FI spectrum of the source N. |
| In the text | |
|
Fig. 11 Broad-band SEDs of Centaurus B and the model curves for the emission of the extended lobes and core in the system. Red circles denote the total radio fluxes within the range 30 MHz−5 GHz (Jones et al. 2001, and references therein) and at 30 GHz measured by Planck. The radio fluxes for the unresolved core, plotted as blue stars, are taken from Jones et al. (2001), Fey et al. (2004) and Burke-Spolaor et al. (2009). The ASCA measurements of the lobes’ and core spectra within the range 0.7−10 keV, as discussed in Tashiro et al. (1998), are denoted by red and blue bow ties, respectively. The Chandra 0.5−7 keV spectrum of the unresolved core is given by cyan bow tie following Marshall et al. (2005). The Fermi-LAT fluxes represented by magenta squares correspond to the analysis presented in Sect. 2 of this paper. The black bow tie denotes the 2−10 keV emission of the nucleus emerging from the analysis of our Suzaku data, while the thick black line shows the 2−10 keV Suzaku upper limit for the lobes’ emission (see Sect. 3). Thick gray curves denote the broad-band emission of the lobes modeled in the framework of the synchrotron and inverse-Compton scenario, while a black dashed curve corresponds to the SSC model of the unresolved core in the system, as discussed in Sect. 5. |
| In the text | |
Current usage metrics show cumulative count of Article Views (full-text article views including HTML views, PDF and ePub downloads, according to the available data) and Abstracts Views on Vision4Press platform.
Data correspond to usage on the plateform after 2015. The current usage metrics is available 48-96 hours after online publication and is updated daily on week days.
Initial download of the metrics may take a while.