Fig. 2
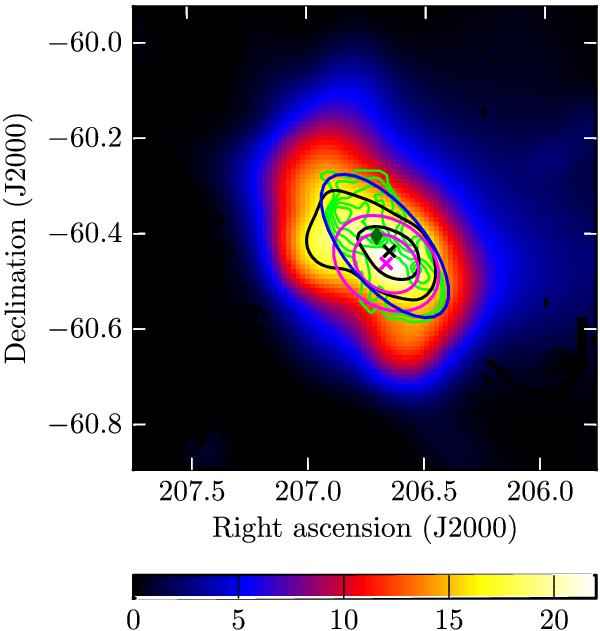
Fermi-LAT TS map obtained with a maximum likelihood analysis using front events above 1 GeV in the vicinity of Centaurus B. Linear green contours of the 843 MHz radio map are overlaid (McAdam 1991). The blue ellipse compatible with the radio lobes is also shown. Black cross and contours represent the estimated position and the positional errors at 68% and 95% confidence levels in this analysis, respectively. Magenta cross and ellipses represent the position and the errors at 68% and 95% confidence levels of 2FGL J1346.6 − 6027. The position of the core of Centaurus B is represented as a diamond.
Current usage metrics show cumulative count of Article Views (full-text article views including HTML views, PDF and ePub downloads, according to the available data) and Abstracts Views on Vision4Press platform.
Data correspond to usage on the plateform after 2015. The current usage metrics is available 48-96 hours after online publication and is updated daily on week days.
Initial download of the metrics may take a while.