Fig. 11
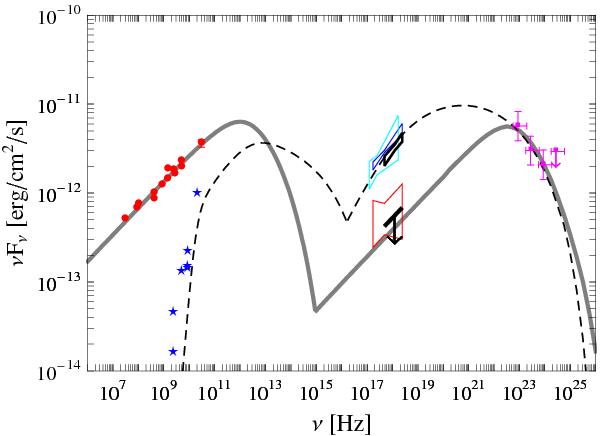
Broad-band SEDs of Centaurus B and the model curves for the emission of the extended lobes and core in the system. Red circles denote the total radio fluxes within the range 30 MHz−5 GHz (Jones et al. 2001, and references therein) and at 30 GHz measured by Planck. The radio fluxes for the unresolved core, plotted as blue stars, are taken from Jones et al. (2001), Fey et al. (2004) and Burke-Spolaor et al. (2009). The ASCA measurements of the lobes’ and core spectra within the range 0.7−10 keV, as discussed in Tashiro et al. (1998), are denoted by red and blue bow ties, respectively. The Chandra 0.5−7 keV spectrum of the unresolved core is given by cyan bow tie following Marshall et al. (2005). The Fermi-LAT fluxes represented by magenta squares correspond to the analysis presented in Sect. 2 of this paper. The black bow tie denotes the 2−10 keV emission of the nucleus emerging from the analysis of our Suzaku data, while the thick black line shows the 2−10 keV Suzaku upper limit for the lobes’ emission (see Sect. 3). Thick gray curves denote the broad-band emission of the lobes modeled in the framework of the synchrotron and inverse-Compton scenario, while a black dashed curve corresponds to the SSC model of the unresolved core in the system, as discussed in Sect. 5.
Current usage metrics show cumulative count of Article Views (full-text article views including HTML views, PDF and ePub downloads, according to the available data) and Abstracts Views on Vision4Press platform.
Data correspond to usage on the plateform after 2015. The current usage metrics is available 48-96 hours after online publication and is updated daily on week days.
Initial download of the metrics may take a while.