| Issue |
A&A
Volume 550, February 2013
|
|
|---|---|---|
| Article Number | A111 | |
| Number of page(s) | 10 | |
| Section | Stellar structure and evolution | |
| DOI | https://doi.org/10.1051/0004-6361/201220181 | |
| Published online | 04 February 2013 | |
Pulse phase and precession phase resolved spectroscopy of Hercules X-1: studying a representative Main-On with RXTE
1
Institut für Astronomie und Astrophysik, Universität Tübingen,
Sand 1,
72076
Tübingen,
Germany
e-mail: This email address is being protected from spambots. You need JavaScript enabled to view it.
2 Sternberg Astronomical Institute, Lomonossov University
Moscow, Russia
Received:
7
August
2012
Accepted:
22
December
2012
Abstract
Aims. We performed a detailed pulse phase resolved spectroscopy of the accreting binary X-ray pulsar Her X-1 in the energy range 3.5–75 keV and have established pulse phase profiles for all spectral parameters. For three parameters, the centroid energy of the cyclotron line, the photon index and the flux of the 6.4 keV iron line, we have studied the variation as a function of 35 d phase.
Methods. We analyzed RXTE observations of the Main-On of November 2002 using data from the PCA and the HEXTE instruments. Four different time intervals of about ~1 d duration were selected to provide a good coverage of a complete Main-On. The intervals are centered at 35 d phases 0.03, 0.10, 0.15, and 0.20, respectively.
Results. All spectral parameters show a strong modulation with pulse phase. While the centroid energy of the cyclotron line follows roughly the shape of the pulse profile, showing higher values close to the peak of the X-ray pulse, both the photon index and the iron line intensity exhibit distinct minima around the peak of the X-ray pulse. With respect to variations of the observed profiles with 35 d phase, we find that there is a clear evolution of the shape of the pulse profiles (flux versus pulse phase), a moderate increase of the maximum cyclotron line energy (found around pulse phase 0.7), but no significant evolution of the shape of the pulse phase profiles of the cyclotron line energy, the spectral power law index or the iron line intensity.
Conclusions. The variation of spectral parameters as a function of the pulse phase provides important information about the system: i. the disappearance of the Fe line flux near the highest continuum flux may be an indication of a hollow cone geometry of the accretion structure; ii. the apparent non-dependence of the cyclotron line energy profiles on 35 d phase provides a new possibility to test the model of free precession of the neutron star, proposed to be responsible for the systematic variations in the pulse profiles.
Key words: pulsars: individual: Her X-1 / stars: neutron / binaries: general
© ESO, 2013
1. Introduction
The X-ray source Her X-1 was discovered in 1972 by Uhuru (Tananbaum et al. 1972), and classified as an accreting X-ray binary. Her X-1 is one of the brightest and most studied persistent binary X-ray pulsars. The distance to the system is ~7 kpc and the masses of the neutron star and its companion are approximately 1.5 M⊙ and 2.2 M⊙, respectively (Reynolds et al. 1997). The X-ray flux shows periodic modulation on several different time-scales: pulsations with 1.24 s due to the spin of the neutron star, eclipses due to the 1.7 d orbital period, and a 35 d super-orbital period due to obscuration of the X-ray emitting region by the precessing accretion disk. This 35 d periodicity shows different states: two On-states with the ~11 d Main-On (at phase 0−0.31) and the ~5 d Short-On (at phase 0.57−0.79), separated by two Off-states (see e.g. Giacconi et al. 1973; Gerend & Boynton 1976; Boynton et al. 1980; Scott & Leahy 1999; Scott et al. 2000; Klochkov et al. 2006). The accretion disk is thought to be tilted (with respect to the orbital plane), warped and counter-precessing with a somewhat variable period of ~35 d. The onset of the flux (often identified with 35 d phase 0.0) is called the Turn-On (TO) and corresponds to the transition from the Off-state to the Main-On. At this time, the outer rim of the disk clears the view to the X-ray emitting region close to the polar caps on the surface of the neutron star, leading to an increase in flux. Vice versa, the decline of the flux towards the end of the Main-On is identified with the inner edge of the accretion disk blocking our view to the X-ray emitting regions. A similar cycle is responsible for the Short-On with a maximum flux of roughly one third that of the Main-On.
Her X-1 was also the first accreting X-ray pulsar for which a cyclotron line in the X-ray spectrum has been discovered (Trümper et al. 1978). This absorption-like feature, now referred to as cyclotron resonance scattering feature (CRSF), is observed around 40 keV and allows to estimate the neutron star’s magnetic field. Applying the formula B12 = (1 + z)Ecyc/11.6 keV (where B12 is the magnetic field strength in units of 1012 Gauss, z is the gravitational redshift and Ecyc is the centroid energy of the cyclotron line), the first direct measurement of the magnetic field of a neutron star was achieved (~3 × 10¹² Gauss for Her X-1). The source shows a positive correlation between the centroid energy of the cyclotron line and the bolometric luminosity (Staubert et al. 2007; Vasco et al. 2011).
Another observational feature of Her X-1 is the evolution of the pulse profile as function of energy and time, or better: 35 d phase. For both the Main-On and the Short-On, a systematic variation in the shape of the pulse profiles is found. These changes consist of the disappearing of some features in the pulse profile with an increase in energy and/or time. These variations repeat systematically on a time scale of ~35 d. These changes have been well known for some time (see e.g. Deeter et al. 1998; Scott et al. 2000; Trümper et al. 1986). Recently, Staubert et al. (2010, 2013) on the basis of RXTE observations, gave a quantitative description of these changes by providing a template, which can be used to predict the shape of the profile in the 9–13 keV energy range for any 35 d phase during the Main-On. An extension of this work for other energy ranges and including the Short-On is in preparation.
Summary of the four intervals of the Main-On of 35 d cycle no. 323.
Trümper et al. (1986), on the basis of observations by Exosat, had proposed that free precession of the neutron star is responsible for those pulse profile changes, due to the variation of the angle of the line of sight to the X-ray emitting regions on the surface of the neutron star. For Her X-1, the dependence of the spectral parameters on pulse phase have been observed by several missions. Early examples are Pravdo et al. (1978) with OSO 8, Pravdo et al. (1979) and Soong et al. (1990) with the A-4 experiment of HEAO-1 and McCray et al. (1982) with HEAO 2 the Einstein Observatory, Voges et al. (1982) with the MPE/AIT ballon experiment, Kahabka (1987) with Exosat, Kunz et al. (1996) with Mir-HEXE. Later examples are Endo et al. (2000) with ASCA, Zane & Ramsay (2001) with XMM-Newton, Lutovinov et al. (2000) with the ART-P telescope on board of GRANADA and Klochkov et al. (2008) with INTEGRAL.
In this work we present a deep investigation of the variation of key spectral parameters as a function of pulse phase with the finest resolution so far and, for the first time, a discussion of a possible evolution with 35 d phase. Changes of the spectral parameters with pulse phase are quite common among accreting X-ray pulsars and are generally attributed to a change in the viewing angle of the accretion region (see e.g., Kreykenbohm et al. 2004 and references therein). Here, we focus on the variation of the centroid energy Ecyc of the CRSF around 40 keV, the photon index Γ and the iron line characteristics. We also address the question whether our data support the free precession model which has been suggested to explain the variation in shape of the pulse profile.
2. Observations and data analysis
To carry out this analysis we used observations of Her X-1 of the Rossi X-ray Timing Explorer (RXTE) performed in November 2002. These observations correspond to cycle number 323 (cycle numbering according to Staubert et al. 2009b) centered at MJD ~52 599.32 with an observed Turn-On of MJD 52 594.80. The data of this cycle provide the best coverage of any Main-On of Her X-1 observed with RXTE. Within this cycle, we sum up observations from four selected time intervals at different 35 d phases in order to have a good coverage of an entire Main-On, avoiding dips and eclipses. All intervals have a duration of about one day (details are given in Table 1). Figure 1 shows the four intervals selected for this analysis.
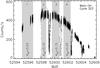 |
Fig. 1 PCA light curve of the Main-On of cycle 323. The grey zones represent the four intervals used for this analysis. For each interval the centered 35 d phase is given. Details of the time and 35 d phase intervals are listed in Table 1. |
For barycentric and binary corrections orbital parameters and the ephemeris of Staubert et al. (2009) were used:
Porb = 1.700167287 d,
Ṗorb = +(2.8 ± 0.2) × 10-12 s s-1,
asini = 13.1831 lt–s and
 2 599.486440 MJD. To align the
pulse profiles, a reference time t0 = MJD 52 594.869900091 and a
spin period Pspin = 1.237761809 s were used. As “pulse phase
zero” the sharp-edge feature at the trailing edge of the right shoulder of the main peak was
used (see Staubert et al. 2009).
2 599.486440 MJD. To align the
pulse profiles, a reference time t0 = MJD 52 594.869900091 and a
spin period Pspin = 1.237761809 s were used. As “pulse phase
zero” the sharp-edge feature at the trailing edge of the right shoulder of the main peak was
used (see Staubert et al. 2009).
The PCA was used in the energy range 3.5–60 keV and HEXTE in the energy range 20–75 keV.
The data have been analyzed with XSPEC 12.6.01 using
the highecut2 spectral model, power law continuum with
an exponential cut-off. The differential photon flux f(E)
is described by: 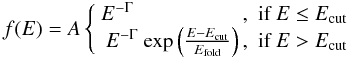 (1)where
Γ is the photon index, Ecut is the cut-off energy and
Efold is the e-folding energy. In addition, two line features
are included in the model: a multiplicative Gaussian optical depth for the CRSF and an
additive Gaussian emission line for the iron fluorescence feature around 6.5 keV. This model
is the same one as used in earlier analyses (see e.g., Coburn
et al. 2002 and Staubert et al. 2007). We
have consistently found that the highecut spectral model describes the spectrum of Her X-1
best. The discontinuity of this model at the cut-off energy does not constitute a problem
and we have verified that no systematic uncertainties are introduced in estimating the
spectral parameters. We used the PCA data up to 60 keV, which has become feasible by new
response matrices (PCA response v11.7, 2009 May 11). These high energy data can definitively
improve the photon statistics at energies around and beyond the cyclotron line feature. The
same choice has been used in previous analyses (see e.g. Ferrigno et al. 2011) and it was confirmed by Rothschild et al. (2011) with RXTE observations of Cen A. The recorn3 spectral component was also added to the model to
normalize the background. After we had verified, that the energy and width of the iron
K line is constant (6.45 keV and 0.5 keV, respectively), we fixed those values in order to
minimize the number of free parameters. GoodXenon4
observational modes of the PCA for high resolution analysis were used to exctract light
curves and spectra. An additional systematic uncertainty of 1% was added in using the PCA
data. To analyze the data, version v6.11 of the HEASOFT software5 and background estimation files
Sky
(1)where
Γ is the photon index, Ecut is the cut-off energy and
Efold is the e-folding energy. In addition, two line features
are included in the model: a multiplicative Gaussian optical depth for the CRSF and an
additive Gaussian emission line for the iron fluorescence feature around 6.5 keV. This model
is the same one as used in earlier analyses (see e.g., Coburn
et al. 2002 and Staubert et al. 2007). We
have consistently found that the highecut spectral model describes the spectrum of Her X-1
best. The discontinuity of this model at the cut-off energy does not constitute a problem
and we have verified that no systematic uncertainties are introduced in estimating the
spectral parameters. We used the PCA data up to 60 keV, which has become feasible by new
response matrices (PCA response v11.7, 2009 May 11). These high energy data can definitively
improve the photon statistics at energies around and beyond the cyclotron line feature. The
same choice has been used in previous analyses (see e.g. Ferrigno et al. 2011) and it was confirmed by Rothschild et al. (2011) with RXTE observations of Cen A. The recorn3 spectral component was also added to the model to
normalize the background. After we had verified, that the energy and width of the iron
K line is constant (6.45 keV and 0.5 keV, respectively), we fixed those values in order to
minimize the number of free parameters. GoodXenon4
observational modes of the PCA for high resolution analysis were used to exctract light
curves and spectra. An additional systematic uncertainty of 1% was added in using the PCA
data. To analyze the data, version v6.11 of the HEASOFT software5 and background estimation files
Sky VLE dated
2005 November 28 were used. We have investigated whether there are correlations between the
fit parameters: no dependence of any single parameter on the others has been found. All
spectral results stated below have been obtained through spectral fits with the assumption
of negligible absorption due to neutral hydrogen, both intrinsic to the source and
interstellar (which is at 5.1 × 1019 cm-2, Dal Fiume et al. 1998). The introduction of absorption as
a free parameter does not lead to a reduction in χ2.
VLE dated
2005 November 28 were used. We have investigated whether there are correlations between the
fit parameters: no dependence of any single parameter on the others has been found. All
spectral results stated below have been obtained through spectral fits with the assumption
of negligible absorption due to neutral hydrogen, both intrinsic to the source and
interstellar (which is at 5.1 × 1019 cm-2, Dal Fiume et al. 1998). The introduction of absorption as
a free parameter does not lead to a reduction in χ2.
For the pulse phase resolved analysis, we have extracted the spectra in 14 pulse phase bins over the 1.24 s pulse, the widths of which were chosen to have roughly identical photon-statistics in each spectrum. The centers of the 14 phase bins are at pulse phases: 0.1, 0.3, 0.45, 0.55, 0.625, 0.675, 0.7125, 0.7375, 0.7625, 0.7875, 0.8250, 0.8750, 0.9250, and 0.9750. For the cyclotron line energy Ecyc this is the finest resolution in pulse phase ever achieved (the four smallest bins around the peak of the pulse have a width of 1/80 of a phase).
With the spectral function described above, good fits with reduced χ2 between 0.9 and 1.2 are generally achieved. However, splitting up the data into small pulse phase intervals reveals that larger χ2 values appear: up to ~12 for the pulse phase range 0.775–0.85, and 1.4–2.8 for the pulse phase range 0.5–0.775. The main reason for this is the existence of the so called “10 keV feature” (see the discussion in 3.5). Modeling this feature by an extra Gaussian is generally successful and brings the χ2 down to acceptable values (in a few cases χ2 is still found around 1.3, which is most likely due to an imperfect modeling by a simple Gaussian).
3. Pulse phase variability
We concentrate on the detailed study of the variation of the following spectral parameters as function of pulse phase: the centroid energy Ecyc of the cyclotron line, the photon index Γ, and the intensity of the iron line at 6.4 keV. The phase profiles of these spectral parameters are compared with the shape of the flux profiles (the “pulse profiles”) for the four different 35 d phase intervals. In Fig. 2 the 9 –13 keV pulse profiles of the four intervals are shown. Note that the pulse profiles are of such high statistical quality that the uncertainties of the flux values (in each of the 128 pulse phase bins) are comparable to the width of the lines chosen to plot the profiles. The profiles are repeated in the following figures (as dashed lines) to allow a direct comparison with the profiles of the spectral parameters. For the remaining spectral parameters, such as the cut-off energy Ecut, the folding energy Efold (with reference to the used spectral model – highecut), and the width and depth of the cyclotron line (σcyc and τcyc), we will restrict ourselves to profiles of the combined data of cycle 323. For these parameters the statistics is such, that no statements can be made about a dependence on 35 d phase. In all Figures, the uncertainties given are one sigma (68%) values.
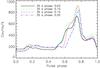 |
Fig. 2 Mean 9–13 keV pulse profiles of the four time intervals at different 35 d phases (see Table 1): Interval 1 in black (solid line), Interval 2 in green (dashed line), Interval 3 in red (dash dotted line) and Interval 4 in blue (dash dot dot dotted line). For general 35 d dependence see Staubert et al. (2010). As timing reference for pulse phase zero we use the “sharp-edge” at the trailing edge of the right shoulder of the main pulse which leads into an eclipse like minimum (Staubert et al. 2009b). Note that these pulse profiles are statistically so accurate that the uncertainties are smaller than the line width. |
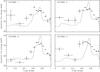 |
Fig. 3 Cyclotron line centroid energy profiles as function of the pulse phase for Interval 1 (top left), Interval 2 (top right), Interval 3 (bottom left) and Interval 4 (bottom right). |
3.1. Cyclotron line energy
The profiles of the cyclotron line energy Ecyc as a function of pulse phase are shown in Figs. 3 and 4. Generally, Ecyc roughly follows the shape of the pulse profile: the broad maximum is found to be close to the peak of the pulse profile (around pulse phase 0.7) for all 35 d phases. The formal uncertainties of Ecyc (as determined by XSPEC) are on the order of a few to several percent for pulse phases 0.0–0.6 and 0.9–1.0 and around one percent or less for pulse phases 0.6–0.9 (close to the peak of the pulse). Adopting an additional systematic uncertainty of 0.15 keV (~0.4%) for all data points, the profiles are well represented by cosine functions (see below). We find slightly different values for the mean Ecyc and the peak-to-peak amplitude: a slight, but significant increase is found as function of 35 d phase. The weighted mean values of the four highest values of Ecyc of each group are 40.16 ± 0.22 keV, 40.89 ± 0.20 keV, 41.02 ± 0.15 keV and 41.52 ± 0.20 keV for mean 35 d phases 0.03, 0.10, 0.15 and 0.20 (intervals 1 through 4), respectively. This corresponds to an increase by ~0.7 keV per 0.1 units in 35 d phase. The minimum Ecyc values have larger uncertainties with a tendency to decrease with 35 d phase, but, within uncertainties, they are consistent with a constant value (around 33.3 keV). The peak-to-peak amplitude is then slightly increasing with 35 d phase (with a mean of ~7.6 keV).
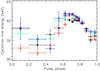 |
Fig. 4 Cyclotron line centroid energy as function of pulse phase for the four different 35 d phase intervals (see Table 1): Interval 1 in black (asterisks), Interval 2 in green (diamonds), Interval 3 in red (triangles) and Interval 4 in blue (squares). |
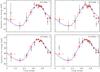 |
Fig. 5 Cyclotron line profiles of Fig. 3 for the four 35 d intervals (black crosses): Interval 1 (top left), Interval 2 (top right), Interval 3 (bottom left) and Interval 4 (bottom right), normalized to a common amplitude. The big red filled dots represent the weighted mean values of all four intervals. The solid blue line represents a best fit function (a combination of two cosine components). We conclude that, within the given statistics, there is no evidence for any change in shape of the profiles with 35 d phase. |
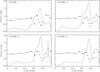 |
Fig. 6 Photon-index profiles as function of pulse phase for Interval 1(top left), Interval 2 (top right), Interval 3 (bottom left) and Interval 4 (bottom right). |
While the values for the maximum Ecyc and the peak-to-peak amplitude are dependent on 35 d phase, the sinusoidal shape of the modulation does not change. To verify this statement, the following analysis was performed: the original Ecyc profiles (Fig. 4) were scaled such that the separation of minimum to maximum Ecyc had a constant value of 7.64 keV, using the minimum values measured in phase bin 0.2–0.4 and the weighted mean of the four highest values in each of the four profiles as reference. In this way, normalized Ecyc profiles were generated. These normalized profiles are shown in Fig. 5, each in comparison to the weighted mean values and a smooth best fit function of the weighted mean: a combination of two cosine functions with common mean (37.31 keV), amplitude (3.82 keV), period and phase-zero values of 0.70 and 0.772 for pulse phases 0.3–0.875 and 1.47 and 0.3 for the remaining phases, respectively. Visually, there is no obvious deviation of any of the four data sets from the weighted mean. As quantitative statistical test we performed the following: comparing the individual normalized profiles with that profile representing the weighted mean leads to χ2 values (normalized to the degrees of freedom) of 0.72, 1.46, 0.72 and 1.32 for the four intervals, respectively. As an additional test, we have then performed a Monte Carlo simulation, in order to answer the following question. Assuming the profiles are indeed the same for all four intervals, that is equal to the best fit mean profile: what is the probability to find an individual profile which deviates from the mean profile in such a way that the χ2 reaches or exceeds the observed value? We have simulated 100 profiles for each of the four intervals, reproducing the statistical conditions of each interval (that is, the widths of the Gaussian distribution from which the random numbers were drawn were chosen according to the uncertainty of the corresponding measured data point). Those probabilities are 68%, 29%, 73% and 4% for the four intervals, respectively. Even 4% for Interval 4 is a rather high and acceptable probability. We conclude, that, within our statistical accuracy, we find no evidence for any change in the shape of the Ecyc profiles with 35 d phase.
3.2. Photon-index
Figure 6 shows the profiles of the photon index Γ as function of the pulse phase. This spectral parameter is relatively constant for pulse phases up to 0.6 (showing a small positive slope), but has a distinct dip around the pulse peak and a smaller one around the left shoulder. The photon-indeces range between 0.42 ± 0.01 and 1.07 ± 0.01 for Interval 1, between 0.54 ± 0.01 and 1.08 ± 0.02 for Interval 2, between 0.36 ± 0.01 and 1.10 ± 0.49 for Interval 3 and between 0.33 ± 0.01 and 1.07 ± 0.01 for Interval 4. In general, the spectrum gets harder when the flux increases. While the main features of the pulse phase dependence of Γ are very much the same in the four 35 d intervals, the depth of the new narrow dip around phase 0.62 shows a clear trend towards smaller values from Interval 1 to Interval 4 (see Fig. 7).
3.3. Iron line intensity
Another spectral parameter which shows a clear modulation as function of pulse phase is the iron line intensity (see Fig. 8). It shows a moderate increase until the left shoulder of the pulse (phase ~0.7), after which it drops almost to zero around pulse phase 0.8, before reaching the start value again at pulse phase 0.9. The minimum is coincident with the peak of the X-ray pulse (see Figs. 8 and 9) in a similar way as the photon index. The iron line intensity ranges between 0 (for all intervals) and 12.40 for Interval 1, 14.62 for Interval 2, 13.19 for Interval 3 and 10.75 for Interval 4. The profiles of 35 d intervals 2–4 are quite similar to one another, while for Interval 1, the iron line intensity is significantly lower for pulse phases <0.6.
3.4. Other spectral parameters
For the other spectral parameters Ecut, Efold the width σcyc and the depth τcyc, we show their pulse phase dependence only for the total data sets (not resolved in 35 d phase), because in these parameters we find a considerably larger scatter, such that no conclusions can be drawn about a possible variation (or not) with 35 d phase (the 35 d phase resolved profiles can be found in Vasco 2012)6. The profiles are shown in Fig. 10. Also for these parameters there is significant modulation with pulse phase, and they generally show a broad maximum around the phase of the pulse peak, with the interesting feature that for Efold there is a dip in this maximum, right at the pulse peak. It is also worth noting, that, except for Efold, the measured values for pulse phases <0.4 are rather high, not following the shape of the pulse profiles.
3.5. The “10 keV feature”
It has been noticed (e.g. Coburn et al. 2002), that in fitting observed spectra of accreting X-ray binaries with a cut-off power law a “wiggle” or “bump” around ~10 keV to ~15 keV is found in the residuals. This applies to many different sources including Her X-1 (also to non-cyclotron line sources), to observations with different satellites (e.g. Ginga, BeppoSAX and RXTE), and to analysis with different spectral functions involving a power law (e.g., highecut,plcut, Fermi-Dirac or NPEX). The feature is therefore considered to be inherent to accreting X-ray binaries. So far, no physical explanation has been suggested.
In our current analysis, using data from observations of Her X-1 by RXTE, this feature does not play a role in the phase averaged analysis. However, in the pulse phase resolved analysis, larger χ2 values appear due to the existence of this “10 keV feature”: up to ~12 for the pulse phase range 0.775–0.85, and 1.4–2.8 for the pulse phase range 0.5–0.775. Modeling this feature by an extra Gaussian is generally successful and brings the χ2 down to acceptable values (in a few cases χ2 is still found around 1.3, which is most likely due to an imperfect modeling by a simple Gaussian). The centroid energy is generally found at ~16 keV with a σ of ~5 keV. Figure 11 shows an example of the spectrum of Interval 3, pulse phase bin 0.80–0.85, where the χ2 is reduced from 5.55 to 1.38 for 224 dof. We have verified, that all the other spectral parameters are not altered when introducing this extra Gaussian. We note that this feature occurs most strongly at a pulse phase close to the peak of the pulse, where all other spectral parameters also tend to show their strongest variability.
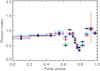 |
Fig. 7 Photon index Γ as function of pulse phase for the four different 35 d phase intervals (see Table 1): Interval 1 in black (asterisks), Interval 2 in green (diamonds), Interval 3 in red (triangles) and Interval 4 in blue (squares). |
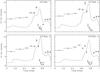 |
Fig. 8 Iron line intensity profiles as function of pulse phase for Interval 1(top left), Interval 2 (top right), Interval 3 (bottom left) and Interval 4 (bottom right). All intensities less than 1.0 are consistent with zero, we therefore show two sigma upperlimits. |
4. Summary and discussion
We have selected the best data available in the RXTE archive of an observation of a Main-On of Her X-1 to perform detailed pulse phase resolved spectroscopy in the energy range 3.5−75 keV. The observations of November 2002 (cycle no. 323) provide the best RXTE coverage of a Main-On (Vasco 2012), such that an attempt could be made to study pulse phase dependent spectral variations also as a function of the phase of the 35 d modulations – flux and shape of the pulse profiles –, which are believed to be due to precessional motion of the accretion disk and, possibly, the neutron star itself. As spectral model we have used a power law with an exponential cut-off (the highecut model in XSPEC) modified by two line features, a multiplicative cyclotron line (in absorption) and an additive iron fluorescence line (in emission). We have concentrated on three spectral parameters: the centroid energy of the cyclotron line, the photon index Γ of the power law component (valid between 3 keV and ~20 keV), and the intensity of the iron fluorescence line at 6.4 keV. For these three parameters, the analysis was performed for four one day long intervals at different mean 35 d phases (0.03, 0.10, 0.15 and 0.20, respectively). For the other spectral parameters of the applied spectral model, no 35 day phase dependence was studied.
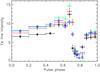 |
Fig. 9 Iron line intensity profiles for the four different 35 d phase intervals (see Table 1): Interval 1 in black (asterisks), Interval 2 in green (diamonds), Interval 3 in red (triangles) and Interval 4 in blue (squares). |
4.1. Pulse phase dependence
The results of the pulse phase resolved analysis can be summarized as follows. We distinguish between results which confirm and improve in statistical significance which was known before and new results.
4.1.1. Confirmed and improved results
-
All spectral parameters show a strong modulation with pulsephase.
-
The strongest variations always appear around the peak of the pulse (at maximum flux).
-
The profile of the centroid energy Ecyc of the cyclotron line follows roughly the modulation of the pulse profile (maximum energy around maximum flux). The shape is close to “sinusoidal”.
-
The photon index profile (Figs. 6 and 7) shows a strong dip close to the pulse peak. The dip around the main peak is a known feature, nicely confirmed here and very well resolved in this analysis.
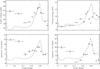 |
Fig. 10 Pulse phase profiles for the cutoff energy Ecut (top left), the folding energy Efold (top right), the width of the cyclotron line σcyc (bottom left), and the depth τcyc of the cyclotron line (bottom right) for the total data sets. |
4.1.2. New results
-
It is the first time that for Her X-1 a phase profile ofthe centroid cyclotron line energyEcyc is produced with such a high resolution and statistical accuracy. The four smallest bins around the peak of the pulse have a width of 1/80 of a phase. The mean variation (minimum to maximum) is ~23% (Figs. 3 and 4). The modulation is close to “sinusoidal”; however, at least two sinusoidal components (with greatly different periods) are needed to model the modulation.
-
For 35 d intervals 1–3, the peak of the Ecyc profile is structured (see Fig. 3), with local maxima near the maximum of the main peak of the pulse profile and around the position of the left shoulder of the main peak. A similar structure is seen in τcyc.
-
The folding energy Efold follows the pulse profile, except for a narrow dip in the peak of the pulse (Fig. 10, upper-right).
-
Similarly, the cut-off energy Ecut, the width and depth of the cyclotron line (σcyc and τcyc), roughly follow the pulse profile, except for higher values at phases 0.0–0.5 (Fig. 10).
-
While the strong dip in the photon index profile (Figs. 6 and 7) close to the main pulse peak was known (even though less well measured), the second, very narrow dip (around phase 0.61) is a newly detected feature. We note that this is close to the position of the left shoulder component of the main peak.
-
The profile of the intensity of the 6.4 keV iron line show a distinct minimum at maximum flux (Figs. 8 and 9).
-
We find that the so called “10 keV feature” seen in the spectra of several accreting binary pulsars, is around 16 keV in Her X-1, with a strong pulse phase dependence: essentially concentrated in the narrow pulse phase interval 0.8–0.9. Spectral fits for all the other phase intervals do not show significant residuals.
4.2. Precession phase dependence
With respect to any variation of the spectral parameters (or their pulse phase variations) with 35 d phase, we consider only the cyclotron line energy Ecyc, the photon index Γ and the intensity of the iron fluorescence line at 6.4 keV. For the other parameters the photon statistics is not sufficient to distinguish between different 35 d phases. It is the first time that a study of the variation of spectral parameters with 35 d phase was done. So, the following results are all new.
-
The maximum value for Ecyc (reached near the pulse peak) shows a slight, but significant increase with 35 d phase. The mean value is 41.0 ± 0.1 keV, and the slope is ~0.7 keV per 0.1 units of 35 d phase.
-
The minimum value for Ecyc (around pulse phase 0.3) is formally consistent with a constant value of 33.5 ± 0.5 keV (we would not rule out a small decrease). Together with the maximum increasing, this means that also the peak-to-peak amplitude (mean value 7.6 ± 0.5 keV) is increasing with 35 d phase.
-
The shape of the Ecyc profile (see Figs. 4 and 5) is independent of 35 d phase.
-
Similarly, the shape of the Γ profiles is independent of 35 d phase, except for the new narrow dip around pulse phase 0.62 (Figs. 6 and 7), where a trend to a smaller depth from Interval 1 to Interval 4 is seen.
-
The shape of the iron line intensity profiles are similar to one another, except for Interval 1 which shows a distinctly lower intensity for pulse phases <0.6 (Figs. 8 and 9).
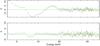 |
Fig. 11 Residuals of the X-ray spectrum of pulse phase bin 0.80–0.85 for Interval 3 without (top) and with (bottom) an extra Gaussian component in the fit. |
4.3. Comparison with previous results and physical conclusions
For Her X-1, the dependence of the spectral parameters on pulse phase have been studied by several authors on the basis of observations with different X-ray instruments (see Introduction). In the following we highlight our new findings and significant improvements and discuss possible physical implications.
Pulse phase dependence of the centroid cyclotron line energy: This modulation is quite common among accreting X-ray pulsars and is generally believed to be due to the changing viewing angle under which the X-ray emitting regions are seen (e.g., Kreykenbohm et al. 2004 and references therein). If we adopt the idea, that peaks (high X-ray flux) in the pulse profile can be associated with beamed radiation emitted from the accreting regions around the magnetic poles, then the observed pulse profiles are a representation of the emission characteristics. During a full neutron star rotation we may be seeing different emitting spots (most likely from a complex magnetic field configuration which deviates from a simple dipole (see e.g. Suchy et al. 2008), possibly having a multi-pole configuration) and the emerging beamed radiation under changing angles. The situation is further complicated by gravitational bending. It is therefore not straightforward to interpret observed pulse profiles in terms of accretion geometry and beaming characteristics (see e.g. Caballero et al. 2011). If we, however, assume that the main peak in the pulse profile of Her X-1 is due to a reasonably narrow pencil beam (following e.g., Pravdo et al. 1978; Klochkov et al. 2008), emitted perpendicular to the neutron star surface at the hot spot of the main accreting pole, then we may associate this pulse phase with a situation where the observer is looking down into the accretion column, parallel to the magnetic field lines and the velocity of the in-falling material. At this phase we see the maximum cyclotron line energy and the hardest spectrum (a sharp minimum in photon index Γ) – that is, we are looking deep down to small distances from the neutron star surface where the magnetic field is strongest and the temperature is highest. Here, we also find the largest width and depth of the cyclotron line, as well as the highest Ecut and a local dip within a broad peak of Efold.
Along similar lines, the newly discovered structure of a second (very sharp) minimum in Γ around pulse phase 0.61 (Fig. 7), corresponding to the left shoulder of the main peak, may be the signature of a second pole. At this pulse phase we also find indications for another relative maximum in Ecyc (Fig. 3).
Pulse phase dependence of the 6.4 keV iron line flux: Figs. 8 and 9 show a sharp and deep minimum of the intensity of the 6.4 keV iron line, again coincident with the main pulse peak. The profile is very similar to that of Γ (Fig. 7) and the Fe line intensity drops to near zero at pulse phase ~0.79 (where Γ is minimal). It is the first time, that such a sharp minimum in the 6.4 keV flux is observed. While Choi et al. (1994), in observations by Ginga, and Zane et al. (2004), in observations by XMM-Newton, had found a sinusoidal-like modulation with a broad minimum around the pulse peak, Oosterbroek et al. (2000), with data from BeppoSAX, were only able to measure the Fe-L line around 1 keV, for which they had found a minimum around the pulse peak which was similarly sharp and deep as we now find for the 6.4 keV line. It is generally believed, that the origin for the Fe lines is fluorescence in relatively cool material which is being illuminated by the X-ray beam. For the geometrical site, however, where this fluorescence is taking place, or whether it is predominantly in reflection or in transmission, no general consensus has been reached so far. Several different regions have been proposed (see. e.g. Choi et al. 1994 and references therein): 1) the outer edge of the accretion disk extended in the vertical direction; 2) a corona of the accretion disk; 3) the atmosphere of the companion star; 4) a surface at the Alfvén radius. The Alfvén surface is currently the most popular one. However, also the accretion column was proposed (e.g., Leahy 2001 and İnam & Baykal 2005), despite the argument by White et al. (1983) that the material in the column may be too hot.
We like to stress the observed fact, that at the pulse phase where we see the highest continuum flux there is essentially no Fe line flux. This should provide some constraints in finding a feasible geometry. If the above adopted scenario is correct, by which we look down into the pencil beam at the pulse peak, the Fe line result may be consistent with a hollow cone geometry, where the majority of the radiation escapes through the empty center of the cone, where there is no material which can fluoresce, while the walls are seen at off-center angles. It is, of course, assumed that the bottom of the cone close to the neutron star surface is filled with X-ray emitting plasma.
The non-dependence of the cyclotron line energy profile on 35 d phase and the model of neutron star free precession: one of the results of this study is the finding that the shape of the cyclotron line energy profile (Ecyc vs. pulse phase) is independent of 35 d phase (Figs. 3 and 4), while the maximum cyclotron line energy increases slightly by ~0.7 keV per 0.1 units of 35 d phase. If we attribute the strong variations in pulse profile with 35 d phase to precession of the neutron star, that is to the change of the angle under which we see the X-ray emitting regions, we would expect also the shape of the cyclotron line energy profile to change with 35 d phase. However, this expectation needs a quantitative analysis. Recently concluded detailed model calculations (Postnov et al. 2012), assuming neutron star free precession, have shown, that under a specific set of assumptions (including a certain multi-pole geometry and emission into narrow pencil beams), the observed pulse profiles in the energy range 9–13 keV (the same as used in Staubert et al. 2010, 2013) can be reproduced with high accuracy. We point out here that the model of Postnov et al. (2012) is an attempt to give a physical explanation of the variation in pulse profiles by neutron star free precession, requiring several specific assumptions, while the template approach of Staubert et al. (2013), mentioned in the Introduction, does not need any physical assumptions, it just makes use of the observed pulse profiles. We plan to investigate whether the here described constancy of the shape of the cyclotron energy profile is consistent with the physical model. In this sense our result opens a new channel to test the model of free precession of the neutron star.
Acknowledgments
This paper is based on observational data taken by the NASA satellite Rossi X-ray Timing Explorer (RXTE). We like to acknowledge the dedication of all people who have contributed to the great success of this mission. D.V. and coauthors thank DLR for financial support through grant 50 OR 0702 and D.K. acknowledges support by the Carl Zeiss Stiftung. We thank the anonymous referee for very valuable comments.
References
- Boynton, P. E., Crosa, L. M., & Deeter, J. E. 1980, ApJ, 237, 169 [NASA ADS] [CrossRef] [Google Scholar]
- Caballero, I., Kraus, U., Santangelo, A., Sasaki, M., & Kretschmar, P. 2011, A&A, 526, A131 [NASA ADS] [CrossRef] [EDP Sciences] [Google Scholar]
- Choi, C. S., Nagase, F., Makino, F., et al. 1994, ApJ, 437, 449 [NASA ADS] [CrossRef] [Google Scholar]
- Coburn, W., Heindl, W. A., Rothschild, R. E., et al. 2002, ApJ, 580, 394 [NASA ADS] [CrossRef] [Google Scholar]
- Dal Fiume, D., Orlandini, M., Cusumano, G., et al. 1998, A&A, 329, L41 [NASA ADS] [Google Scholar]
- Deeter, J. E., Scott, D. M., Boynton, P. E., et al. 1998, ApJ, 502, 802 [NASA ADS] [CrossRef] [Google Scholar]
- Endo, T., Nagase, F., & Mihara, T. 2000, PASJ, 52, 223 [NASA ADS] [Google Scholar]
- Ferrigno, C., Falanga, M., Bozzo, E., et al. 2011, in The X-ray Universe 2011, eds. J.-U. Ness, & M. Ehle, 69 [Google Scholar]
- Gerend, D., & Boynton, P. E. 1976, ApJ, 209, 562 [NASA ADS] [CrossRef] [Google Scholar]
- Giacconi, R., Gursky, H., Kellogg, E., et al. 1973, ApJ, 184, 227 [NASA ADS] [CrossRef] [Google Scholar]
- İnam, S. C., & Baykal, A. 2005, MNRAS, 361, 1393 [NASA ADS] [CrossRef] [Google Scholar]
- Kahabka, P. 1987, MPE Rep., 204 [Google Scholar]
- Klochkov, D., Shakura, N., Postnov, K., Staubert, R., & Wilms, J. 2006, Proc. of the 363. WE-Heraeus Seminar on: Neutron Stars and Pulsars (Posters and contributed talks) Physikzentrum Bad Honnef, Germany, May 14–19, eds. W. Becker, & H. H. Huang, MPE Report, 291, 212 [Google Scholar]
- Klochkov, D., Staubert, R., Postnov, K., et al. 2008, A&A, 482, 907 [NASA ADS] [CrossRef] [EDP Sciences] [Google Scholar]
- Kreykenbohm, I., Wilms, J., Coburn, W., et al. 2004, A&A, 427, 975 [NASA ADS] [CrossRef] [EDP Sciences] [Google Scholar]
- Kunz, M., Kendziorra, E., Kretschmar, P., et al. 1996, A&AS, 120, C233 [NASA ADS] [Google Scholar]
- Leahy, D. A. 2001, in Int. Cosm. Ray Conf., 6, 2536 [Google Scholar]
- Lutovinov, A. A., Grebenev, S. A., Pavlinsky, M. N., & Sunyaev, R. A. 2000, Astron. Lett., 26, 691 [NASA ADS] [CrossRef] [Google Scholar]
- McCray, R. A., Shull, J. M., Boynton, P. E., et al. 1982, ApJ, 262, 301 [NASA ADS] [CrossRef] [Google Scholar]
- Oosterbroek, T., Parmar, A. N., Dal Fiume, D., et al. 2000, A&A, 353, 575 [NASA ADS] [Google Scholar]
- Postnov, K., Shakura, N., & Staubert, R. 2012, MNRAS, submitted [Google Scholar]
- Pravdo, S. H., Bussard, R. W., Becker, R. H., et al. 1978, ApJ, 225, 988 [NASA ADS] [CrossRef] [Google Scholar]
- Pravdo, S. H., Bussard, R. W., & White, N. E. 1979, MNRAS, 188, 5 [NASA ADS] [Google Scholar]
- Reynolds, A. P., Quaintrell, H., Still, M. D., et al. 1997, MNRAS, 288, 43 [NASA ADS] [CrossRef] [Google Scholar]
- Rothschild, R. E., Markowitz, A., Rivers, E., et al. 2011, ApJ, 733, 23 [NASA ADS] [CrossRef] [Google Scholar]
- Scott, D. M., & Leahy, D. A. 1999, ApJ, 510, 974 [NASA ADS] [CrossRef] [Google Scholar]
- Scott, D. M., Leahy, D. A., & Wilson, R. B. 2000, ApJ, 539, 392 [NASA ADS] [CrossRef] [Google Scholar]
- Soong, Y., Gruber, D. E., Peterson, L. E., & Rothschild, R. E. 1990, ApJ, 348, 641 [NASA ADS] [CrossRef] [Google Scholar]
- Staubert, R., Shakura, N. I., Postnov, K., et al. 2007, A&A, 465, L25 [NASA ADS] [CrossRef] [EDP Sciences] [Google Scholar]
- Staubert, R., Klochkov, D., & Wilms, J. 2009, A&A, 500, 883 [NASA ADS] [CrossRef] [EDP Sciences] [Google Scholar]
- Staubert, R., Klochkov, D., Vasco, D., & Wilms, J. 2010, in Proc. of the 8th INTEGRAL Workshop ”The Restless Gamma-ray Universe” (INTEGRAL 2010). September 27–30, Dublin Castle, Dublin, Ireland [arXiv:1110.6717] [Google Scholar]
- Staubert, R., Klochkov, D., Vasco, D., et al. 2013, A&A, in press, DOI: 10.1051/0004-6361/201220316 [Google Scholar]
- Suchy, S., Pottschmidt, K., Wilms, J., et al. 2008, ApJ, 675, 1487 [NASA ADS] [CrossRef] [Google Scholar]
- Tananbaum, H., Gursky, H., Kellogg, E. M., et al. 1972, ApJ, 174, L143 [NASA ADS] [CrossRef] [Google Scholar]
- Trümper, J., Kahabka, P., Oegelman, H., Pietsch, W., & Voges, W. 1986, ApJ, 300, L63 [NASA ADS] [CrossRef] [Google Scholar]
- Trümper, J., Pietsch, W., Reppin, C., et al. 1978, ApJ, 219, L105 [NASA ADS] [CrossRef] [Google Scholar]
- Vasco, D. 2012, Ph.D. Thesis, Univ. of Tübingen, Germany [Google Scholar]
- Vasco, D., Klochkov, D., & Staubert, R. 2011, A&A, 532, A99 [NASA ADS] [CrossRef] [EDP Sciences] [Google Scholar]
- Voges, W., Pietsch, W., Reppin, C., et al. 1982, ApJ, 263, 803 [NASA ADS] [CrossRef] [Google Scholar]
- White, N. E., Swank, J. H., & Holt, S. S. 1983, ApJ, 270, 711 [NASA ADS] [CrossRef] [Google Scholar]
- Zane, S., & Ramsay, G. 2001, in Two Years of Science with Chandra, meeting abstracts from the Symp. held in Washington, DC, 5−7 September [Google Scholar]
- Zane, S., Ramsay, G., Jimenez-Garate, M. A., Willem den Herder, J., & Hailey, C. J. 2004, MNRAS, 350, 506 [NASA ADS] [CrossRef] [Google Scholar]
All Tables
All Figures
|
Fig. 1 PCA light curve of the Main-On of cycle 323. The grey zones represent the four intervals used for this analysis. For each interval the centered 35 d phase is given. Details of the time and 35 d phase intervals are listed in Table 1. |
| In the text | |
|
Fig. 2 Mean 9–13 keV pulse profiles of the four time intervals at different 35 d phases (see Table 1): Interval 1 in black (solid line), Interval 2 in green (dashed line), Interval 3 in red (dash dotted line) and Interval 4 in blue (dash dot dot dotted line). For general 35 d dependence see Staubert et al. (2010). As timing reference for pulse phase zero we use the “sharp-edge” at the trailing edge of the right shoulder of the main pulse which leads into an eclipse like minimum (Staubert et al. 2009b). Note that these pulse profiles are statistically so accurate that the uncertainties are smaller than the line width. |
| In the text | |
|
Fig. 3 Cyclotron line centroid energy profiles as function of the pulse phase for Interval 1 (top left), Interval 2 (top right), Interval 3 (bottom left) and Interval 4 (bottom right). |
| In the text | |
|
Fig. 4 Cyclotron line centroid energy as function of pulse phase for the four different 35 d phase intervals (see Table 1): Interval 1 in black (asterisks), Interval 2 in green (diamonds), Interval 3 in red (triangles) and Interval 4 in blue (squares). |
| In the text | |
|
Fig. 5 Cyclotron line profiles of Fig. 3 for the four 35 d intervals (black crosses): Interval 1 (top left), Interval 2 (top right), Interval 3 (bottom left) and Interval 4 (bottom right), normalized to a common amplitude. The big red filled dots represent the weighted mean values of all four intervals. The solid blue line represents a best fit function (a combination of two cosine components). We conclude that, within the given statistics, there is no evidence for any change in shape of the profiles with 35 d phase. |
| In the text | |
|
Fig. 6 Photon-index profiles as function of pulse phase for Interval 1(top left), Interval 2 (top right), Interval 3 (bottom left) and Interval 4 (bottom right). |
| In the text | |
|
Fig. 7 Photon index Γ as function of pulse phase for the four different 35 d phase intervals (see Table 1): Interval 1 in black (asterisks), Interval 2 in green (diamonds), Interval 3 in red (triangles) and Interval 4 in blue (squares). |
| In the text | |
|
Fig. 8 Iron line intensity profiles as function of pulse phase for Interval 1(top left), Interval 2 (top right), Interval 3 (bottom left) and Interval 4 (bottom right). All intensities less than 1.0 are consistent with zero, we therefore show two sigma upperlimits. |
| In the text | |
|
Fig. 9 Iron line intensity profiles for the four different 35 d phase intervals (see Table 1): Interval 1 in black (asterisks), Interval 2 in green (diamonds), Interval 3 in red (triangles) and Interval 4 in blue (squares). |
| In the text | |
|
Fig. 10 Pulse phase profiles for the cutoff energy Ecut (top left), the folding energy Efold (top right), the width of the cyclotron line σcyc (bottom left), and the depth τcyc of the cyclotron line (bottom right) for the total data sets. |
| In the text | |
|
Fig. 11 Residuals of the X-ray spectrum of pulse phase bin 0.80–0.85 for Interval 3 without (top) and with (bottom) an extra Gaussian component in the fit. |
| In the text | |
Current usage metrics show cumulative count of Article Views (full-text article views including HTML views, PDF and ePub downloads, according to the available data) and Abstracts Views on Vision4Press platform.
Data correspond to usage on the plateform after 2015. The current usage metrics is available 48-96 hours after online publication and is updated daily on week days.
Initial download of the metrics may take a while.