Fig. 5
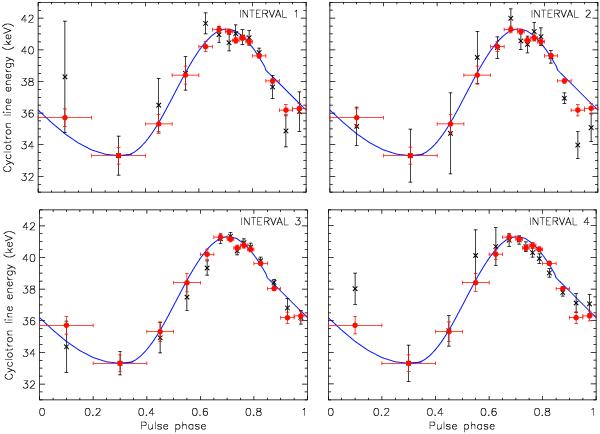
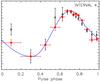
Cyclotron line profiles of Fig. 3 for the four 35 d intervals (black crosses): Interval 1 (top left), Interval 2 (top right), Interval 3 (bottom left) and Interval 4 (bottom right), normalized to a common amplitude. The big red filled dots represent the weighted mean values of all four intervals. The solid blue line represents a best fit function (a combination of two cosine components). We conclude that, within the given statistics, there is no evidence for any change in shape of the profiles with 35 d phase.
Current usage metrics show cumulative count of Article Views (full-text article views including HTML views, PDF and ePub downloads, according to the available data) and Abstracts Views on Vision4Press platform.
Data correspond to usage on the plateform after 2015. The current usage metrics is available 48-96 hours after online publication and is updated daily on week days.
Initial download of the metrics may take a while.