Fig. 2
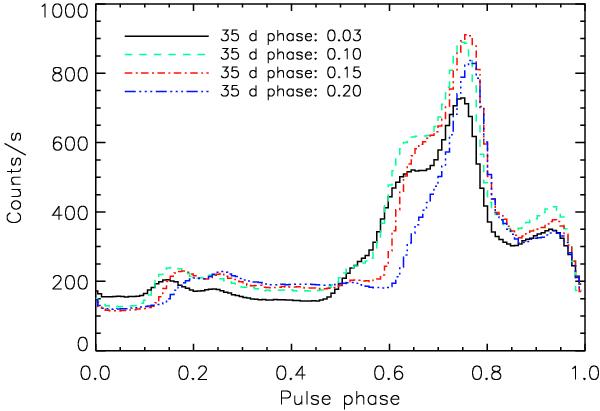
Mean 9–13 keV pulse profiles of the four time intervals at different 35 d phases (see Table 1): Interval 1 in black (solid line), Interval 2 in green (dashed line), Interval 3 in red (dash dotted line) and Interval 4 in blue (dash dot dot dotted line). For general 35 d dependence see Staubert et al. (2010). As timing reference for pulse phase zero we use the “sharp-edge” at the trailing edge of the right shoulder of the main pulse which leads into an eclipse like minimum (Staubert et al. 2009b). Note that these pulse profiles are statistically so accurate that the uncertainties are smaller than the line width.
Current usage metrics show cumulative count of Article Views (full-text article views including HTML views, PDF and ePub downloads, according to the available data) and Abstracts Views on Vision4Press platform.
Data correspond to usage on the plateform after 2015. The current usage metrics is available 48-96 hours after online publication and is updated daily on week days.
Initial download of the metrics may take a while.