Fig. 6
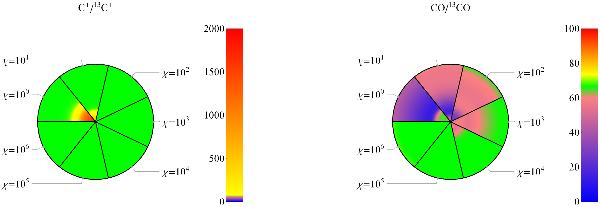
Fractionation structure as function of relative clump radius r/Rtot for n = 103 cm-3 and M = 1 M⊙. Each sector corresponds to a different χ value. The FR is color coded, ratios within ± 10% of the ER are shown in green. Left panel: FR of C+, the color scale goes from 0 to 2000. Right panel: FR of CO, the color scale goes from 0 to 100.
Current usage metrics show cumulative count of Article Views (full-text article views including HTML views, PDF and ePub downloads, according to the available data) and Abstracts Views on Vision4Press platform.
Data correspond to usage on the plateform after 2015. The current usage metrics is available 48-96 hours after online publication and is updated daily on week days.
Initial download of the metrics may take a while.