Fig. C.3
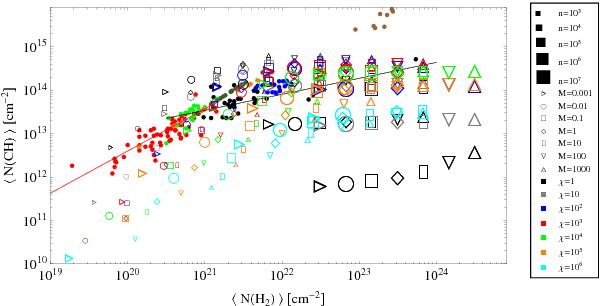
Mean CH column density versus H2 column density (color/shape coding same as Fig. 9). Observational results are plotted as colored points (red: Sheffer et al. 2008; green: Rachford et al. 2002; olive: Magnani et al. 2005; black: Qin et al. 2010; brown: Magnani et al. 2006; orange Gerin et al. 2010; blue Suutarinen et al. 2011). The two lines are the CH − H2 relations from Mattila (1986) (red) and Qin et al. (2010) (black).
Current usage metrics show cumulative count of Article Views (full-text article views including HTML views, PDF and ePub downloads, according to the available data) and Abstracts Views on Vision4Press platform.
Data correspond to usage on the plateform after 2015. The current usage metrics is available 48-96 hours after online publication and is updated daily on week days.
Initial download of the metrics may take a while.