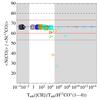
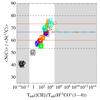
Fig. 24
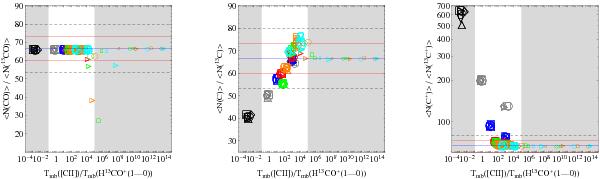
Column density fractionation ratios plotted against the emission line ratio Tmb( [CII] )/Tmb(H13CO + (1 − 0)) for all models from our parameter space (blue: ER, red: ER ± 10%, dashed: ER ± 20%). The symbols follow the coding from Fig. 9. The gray areas denote the regime below a sensitivity limit of Tmb < 0.01 K km s-1. Left panel: N(CO)/N(13CO), middle panel: N(C)/N(13C), right panel:  .
.
Current usage metrics show cumulative count of Article Views (full-text article views including HTML views, PDF and ePub downloads, according to the available data) and Abstracts Views on Vision4Press platform.
Data correspond to usage on the plateform after 2015. The current usage metrics is available 48-96 hours after online publication and is updated daily on week days.
Initial download of the metrics may take a while.