Fig. 2
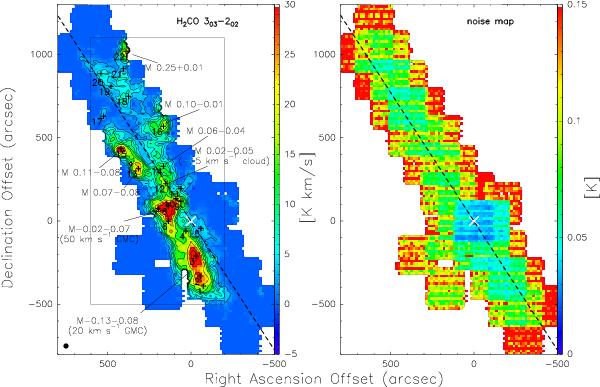
H2CO (303 → 202) integrated intensity map (left)
and the noise map (right) observed with the APEX in the GC. Left:
black contour levels for the molecular line emission (on a
 scale)
are −3, 3, 6, 9, 12, 15, 20, 30, 40, 50 σ (1σ=0.72 K
km s-1). The black rectangle shows a smaller region where most of the
molecular line emission is detected. The molecular cloud labels with M followed by the
galactic coordinates are adopted from Güsten et al. (1981). The wedge at the side shows the intensity range of the line emission
on a scale.
The beam size of 30″ is shown in the bottom-left corner. Right: noise
map across the region. The wedge at the side shows the range of noise on a
scale at
a velocity resolution of 2 km s-1. The spectra presented in Fig. B.1 are shown as the plus symbols with numbers.
Sgr A∗ is the reference position and shown as a white cross symbol. The
dashed line marks the Galactic plane through Sgr A∗.
scale)
are −3, 3, 6, 9, 12, 15, 20, 30, 40, 50 σ (1σ=0.72 K
km s-1). The black rectangle shows a smaller region where most of the
molecular line emission is detected. The molecular cloud labels with M followed by the
galactic coordinates are adopted from Güsten et al. (1981). The wedge at the side shows the intensity range of the line emission
on a scale.
The beam size of 30″ is shown in the bottom-left corner. Right: noise
map across the region. The wedge at the side shows the range of noise on a
scale at
a velocity resolution of 2 km s-1. The spectra presented in Fig. B.1 are shown as the plus symbols with numbers.
Sgr A∗ is the reference position and shown as a white cross symbol. The
dashed line marks the Galactic plane through Sgr A∗.
Current usage metrics show cumulative count of Article Views (full-text article views including HTML views, PDF and ePub downloads, according to the available data) and Abstracts Views on Vision4Press platform.
Data correspond to usage on the plateform after 2015. The current usage metrics is available 48-96 hours after online publication and is updated daily on week days.
Initial download of the metrics may take a while.