Fig. 12
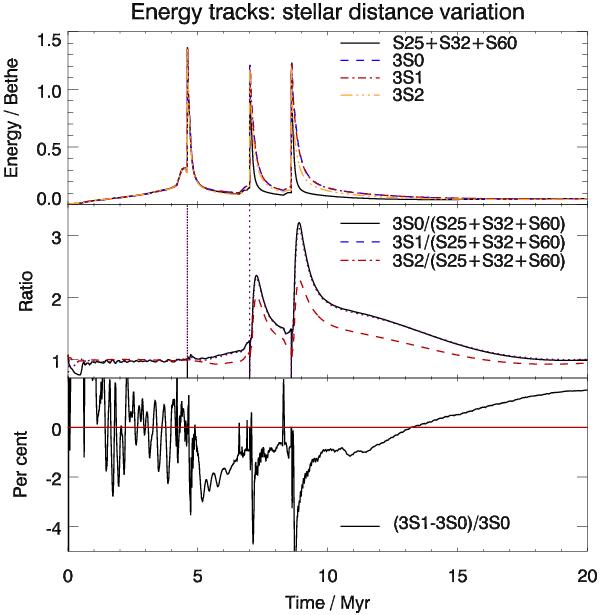
Energy tracks for different simulations, where only the positions of the three stars differ. Run labels in the legends are explained in Table 1. S25 + S32 + S60 refers to the sum of the energy tracks of the three simulations of the bubbles of the isolated 25 M⊙, 32 M⊙ and 60 M⊙ stars, respectively, which corresponds to a very large distance. 3S0 is the opposite case, where three stars are in the same region. Top: absolute values. Middle: three-stars simulations relative to the sum of the three isolated bubbles. Interpolations always use the 3S0 time base. Interpolation artefacts are visible at the discontinuities due to the supernovae (4.6, 7.0 and 8.6 Myr). Bottom: difference of the very similar energy tracks of runs 3S1 and 3S0, normalised to 3S0 as a percentage. The solid red line marks zero. The difference has been set to zero for the time intervals 10,000 yr around each supernova in order to mask the interpolation artefacts. See text for details.
Current usage metrics show cumulative count of Article Views (full-text article views including HTML views, PDF and ePub downloads, according to the available data) and Abstracts Views on Vision4Press platform.
Data correspond to usage on the plateform after 2015. The current usage metrics is available 48-96 hours after online publication and is updated daily on week days.
Initial download of the metrics may take a while.