Fig. 8
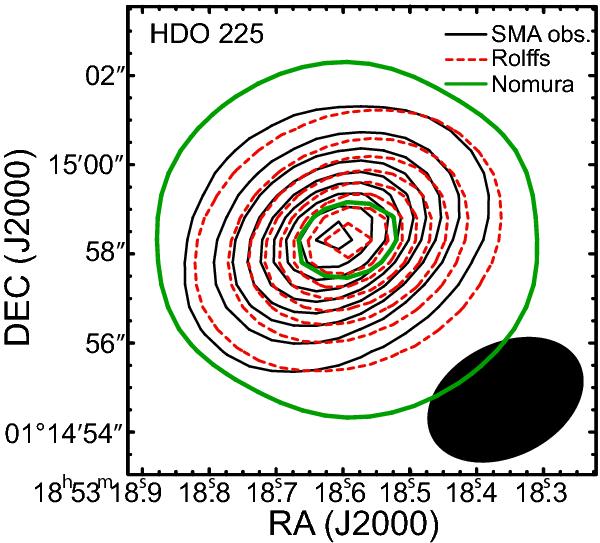
Overlay of the HDO 225 GHz integrated map observed with the SMA (black contours) with the simulated ones of the best-fit results of the Rolffs model and of the Nomura model excluding the HDO spectrum at 893 GHz. The red and green contours show the integrated HDO 225 GHz map of the best-fit results of the Rolffs model and of the Nomura model excluding the HDO spectrum at 893 GHz. These two integrated maps are simulated to be observed with the uv-coverage of the SMA observations. All contour levels are from 3σ by steps of 5σ, with 1σ = 1.5 Jy beam-1. The black ellipse indicates the beam size.
Current usage metrics show cumulative count of Article Views (full-text article views including HTML views, PDF and ePub downloads, according to the available data) and Abstracts Views on Vision4Press platform.
Data correspond to usage on the plateform after 2015. The current usage metrics is available 48-96 hours after online publication and is updated daily on week days.
Initial download of the metrics may take a while.