Fig. 7
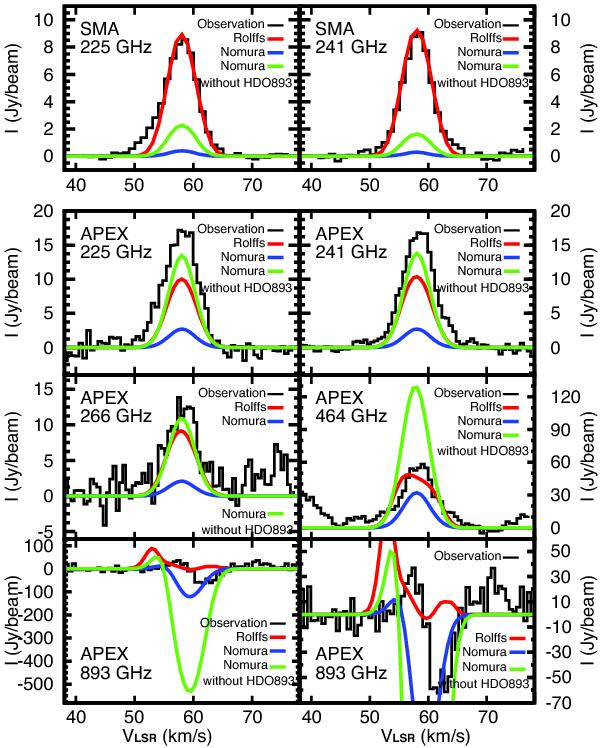
Comparison of the observed spectra with the results of our best-fit models for the
two different physical profiles. The observed line emission is shown as black
histograms in each spectrum. The red, green, and blue lines show the best-fit
results of the Rolffs model, the Nomura model with all spectra, and the Nomura model
excluding the HDO spectrum at 893 GHz (X ;
X
;
X ).
).
Current usage metrics show cumulative count of Article Views (full-text article views including HTML views, PDF and ePub downloads, according to the available data) and Abstracts Views on Vision4Press platform.
Data correspond to usage on the plateform after 2015. The current usage metrics is available 48-96 hours after online publication and is updated daily on week days.
Initial download of the metrics may take a while.