Fig. 4
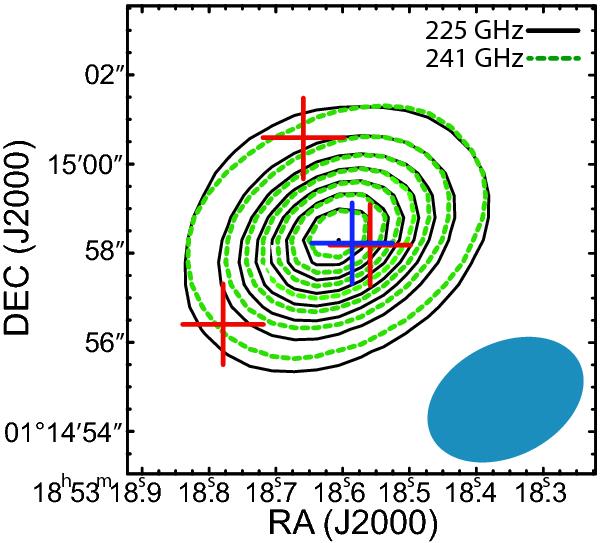
HDO 225 GHz (black contours) and HDO 241 GHz (green-dashed contours) integrated map observed with the SMA. The contour levels are from 3σ by steps of 6σ, with 1σ = 1.5 Jy beam-1. The red crosses indicate the peak of the 24 GHz free-free continuum emission (A, B, and C positions from Heaton et al. 1989) and the peak (maximum pixel) of the 1.3 mm continuum observed with the SMA is shown with the dark blue cross. The blue ellipse indicates the beam size.
Current usage metrics show cumulative count of Article Views (full-text article views including HTML views, PDF and ePub downloads, according to the available data) and Abstracts Views on Vision4Press platform.
Data correspond to usage on the plateform after 2015. The current usage metrics is available 48-96 hours after online publication and is updated daily on week days.
Initial download of the metrics may take a while.