Fig. 3
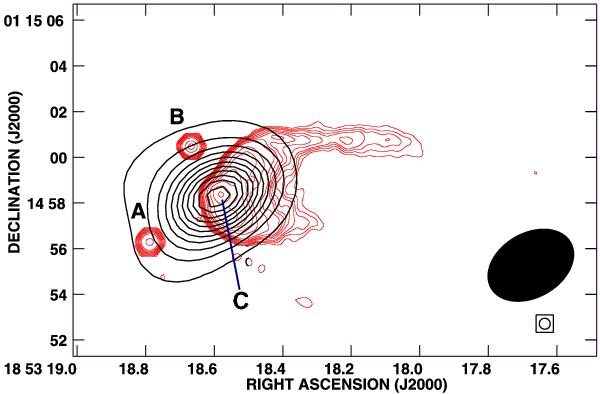
Overlay of the 1.3 mm continuum emission observed with the SMA (black contours)
with the red contours of the 43.3 GHz free-free continuum emission observed by
Avalos et al. (2006). Contour levels are
from 3σ by steps of 6σ, with 1σ
= 0.1 Jy beam-1 for the SMA images and at −4, −3, 3, 4, 5, 6, 8, 10,
12, 15, 20, 40, 60, 100, 200, 400, and 800 times the noise, with
1σ = 1.04 mJy beam-1 for the 43.3 GHz images. The
synthesized beams of the SMA (black) and free-free emission (red) images are shown
in the lower right of the plot. The synthesized beam of the 2-cm image is
1 00 ×
085 with PA = 35°.
00 ×
085 with PA = 35°.
Current usage metrics show cumulative count of Article Views (full-text article views including HTML views, PDF and ePub downloads, according to the available data) and Abstracts Views on Vision4Press platform.
Data correspond to usage on the plateform after 2015. The current usage metrics is available 48-96 hours after online publication and is updated daily on week days.
Initial download of the metrics may take a while.