Fig. 15
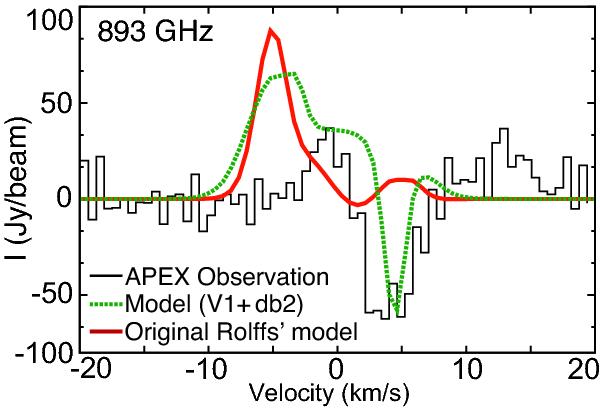
Comparison of the observed spectrum, the one of the best-fit model simulated with Rolffs’ original physical profile, and the one reproduced with the modified turbulent and infall velocity fields (V1 and db2). The fractional abundance adopted here is the one of the best-fit model.
Current usage metrics show cumulative count of Article Views (full-text article views including HTML views, PDF and ePub downloads, according to the available data) and Abstracts Views on Vision4Press platform.
Data correspond to usage on the plateform after 2015. The current usage metrics is available 48-96 hours after online publication and is updated daily on week days.
Initial download of the metrics may take a while.