Fig. 10
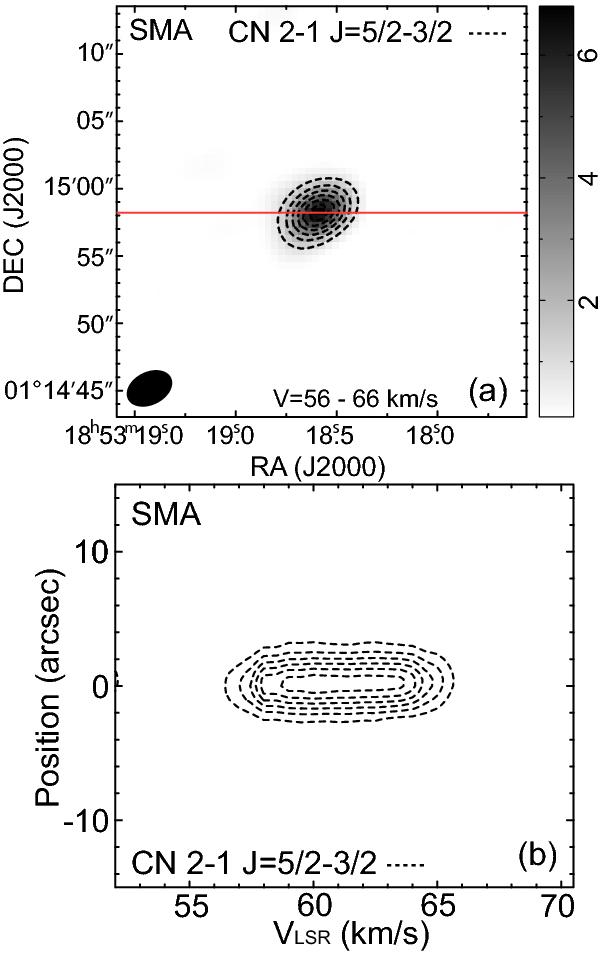
Integrated moment-0 map of CN 2-1 J = 5/2−3/2 F = 7/2−5/2 line (blended with the F = 5/2−3/2 and F = 3/2−1/2 lines) overlaid with the dust continuum map a). The red line indicates the cut for the position-velocity (P − V) diagram. The P − V diagram of the CN line b). Both are observed with SMA. The contours in a) are −0.67, −1.34, −2.01, −2.68, −3.35, and −4.02 and in b) they are −0.97, −1.94, −2.91, −3.88, −4.86, and −5.83. The P − V diagram is cut at the position of the observed center and position angle of 0.
Current usage metrics show cumulative count of Article Views (full-text article views including HTML views, PDF and ePub downloads, according to the available data) and Abstracts Views on Vision4Press platform.
Data correspond to usage on the plateform after 2015. The current usage metrics is available 48-96 hours after online publication and is updated daily on week days.
Initial download of the metrics may take a while.