Fig. 1
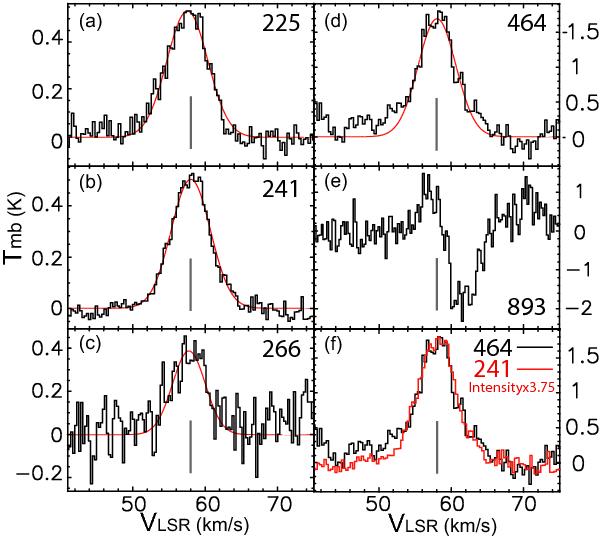
a)–e) HDO spectra observed with APEX. The red lines indicate the results of the Gaussian fit. f) Comparison of the HDO 464 and 241 GHz spectra. The numbers in the plots indicate the observed frequencies (in GHz). The gray vertical lines are at VLSR = 58 km s-1.
Current usage metrics show cumulative count of Article Views (full-text article views including HTML views, PDF and ePub downloads, according to the available data) and Abstracts Views on Vision4Press platform.
Data correspond to usage on the plateform after 2015. The current usage metrics is available 48-96 hours after online publication and is updated daily on week days.
Initial download of the metrics may take a while.