Fig. 9
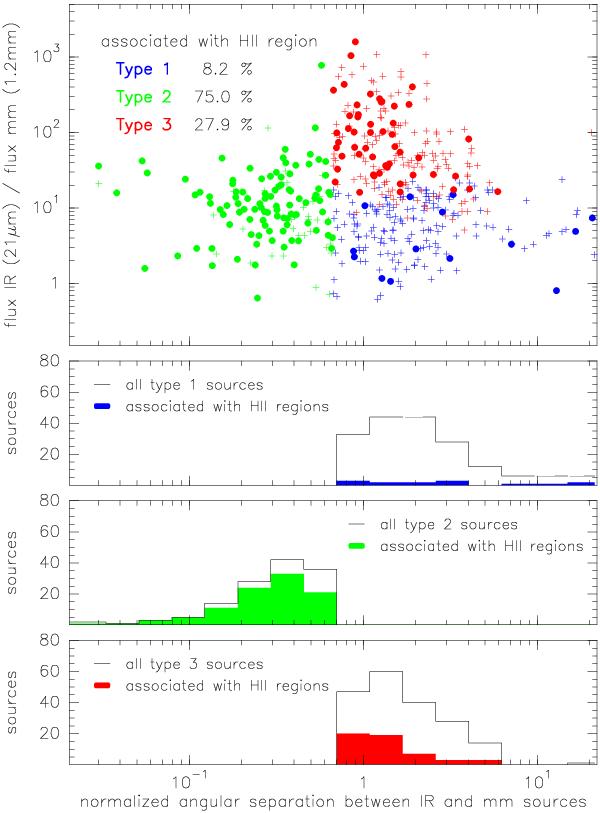
Associations with H ii regions. Top: 21 μm to 1.2 mm flux ratio versus the normalized angular separation between millimeter and infrared sources as in Fig. 8. Blue symbols correspond to Type 1 sources (only millimeter emission), green symbols correspond to Type 2 sources (association between millimeter and infrared emission); and red symbols correspond to Type 3 sources (only infrared emission). Colored filled dots show those objects associated with H ii regions detected with ATCA (see Table 3). The numbers at the top of the panel indicate the percentage of association of H ii regions in each of three groups. Bottom: histograms of the normalized angular separation for the different groups. The solid black lines correspond to all sources of each group and the colored filled histograms correspond those objects associated with H ii regions.
Current usage metrics show cumulative count of Article Views (full-text article views including HTML views, PDF and ePub downloads, according to the available data) and Abstracts Views on Vision4Press platform.
Data correspond to usage on the plateform after 2015. The current usage metrics is available 48-96 hours after online publication and is updated daily on week days.
Initial download of the metrics may take a while.