Fig. 7
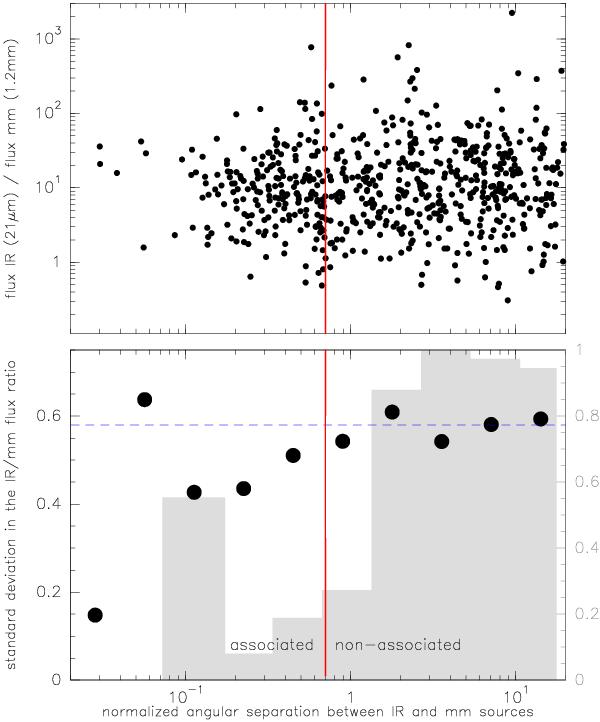
Top: 21 μm-to-1.2 mm flux ratio versus the normalized angular separation between millimeter and infrared sources (see Sect. 6.1 for details). The flux at 21 μm flux is obtained from the MSX catalog and the flux at 1.2 mm is obtained from Beltrán et al. (2006). Bottom: standard deviation in the 21 μm-to-1.2 mm flux ratio versus the normalized angular separation (black dots). The dashed horizontal blue line corresponds to the standard deviation (≃0.57) for data with Δn > 0.7. The gray histogram indicates the probability that the distribution of data within one bin is the same as the global distribution with Δn > 1, using the Kolmogorov-Smirnov statistical test. The red vertical line indicates the normalized angular separation that distinguishes between millimeter and infrared associated and non-associated sources (see Sect. 6.1).
Current usage metrics show cumulative count of Article Views (full-text article views including HTML views, PDF and ePub downloads, according to the available data) and Abstracts Views on Vision4Press platform.
Data correspond to usage on the plateform after 2015. The current usage metrics is available 48-96 hours after online publication and is updated daily on week days.
Initial download of the metrics may take a while.