Fig. 5
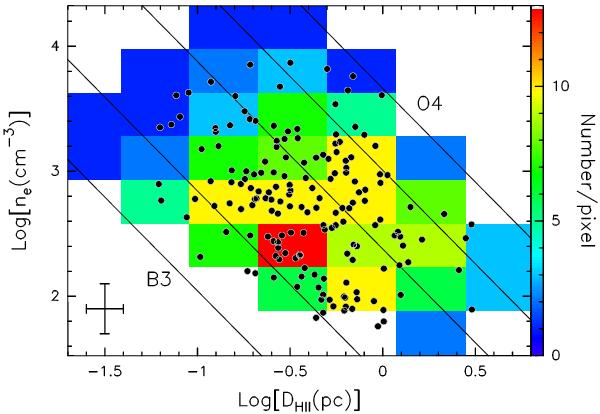
Electron density of the H ii regions detected in our survey versus the corresponding linear diameter. The points denoting the data (listed in Table 5) are overlaid on an image whose intensity (color scale) gives the number of H ii regions expected in each pixel on the basis of the model described in Appendix A. The solid lines correspond to ZAMS stars of spectral types B3, B1, B0, O7, and O4. The cross indicates the 20% error in the electron density and the 10% error in the source size (see Sect. 5.1).
Current usage metrics show cumulative count of Article Views (full-text article views including HTML views, PDF and ePub downloads, according to the available data) and Abstracts Views on Vision4Press platform.
Data correspond to usage on the plateform after 2015. The current usage metrics is available 48-96 hours after online publication and is updated daily on week days.
Initial download of the metrics may take a while.