Fig. 4
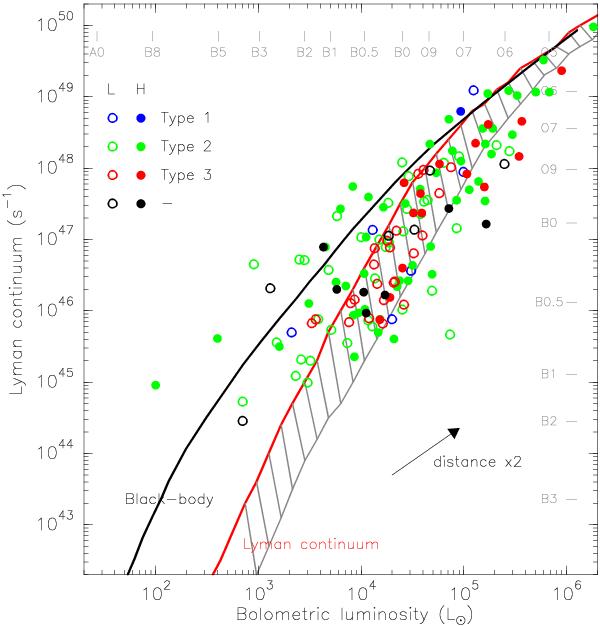
Lyman continuum, NLy (from Table 5), as a function of the bolometric luminosity, Lbol. Open and filled symbols denote Low and High sources, respectively. The different colors indicate the Type 1 (blue), Type 2 (green), and Type 3 (red), while the black symbols correspond to those centimeter sources not classified in any of the three types (see Sect. 6). The red solid line corresponds to the Lyman continuum of a ZAMS star of a given bolometric luminosity, while the dashed region indicates the expected NLy if Lbol is due to a cluster (see Sect. 5.2 for details). The black solid line corresponds to the Lyman continuum expected from a black-body with the same radius and temperature as a ZAMS star. At the top and right axes we list the spectral type corresponding to a given Lyman continuum and a given bolometric luminosity. The arrow indicates by how much a point should be shifted if its distance is doubled.
Current usage metrics show cumulative count of Article Views (full-text article views including HTML views, PDF and ePub downloads, according to the available data) and Abstracts Views on Vision4Press platform.
Data correspond to usage on the plateform after 2015. The current usage metrics is available 48-96 hours after online publication and is updated daily on week days.
Initial download of the metrics may take a while.