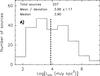
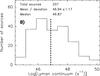
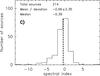
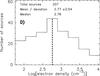
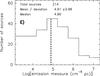
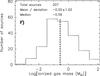
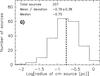
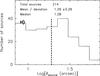
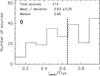
Fig. 3
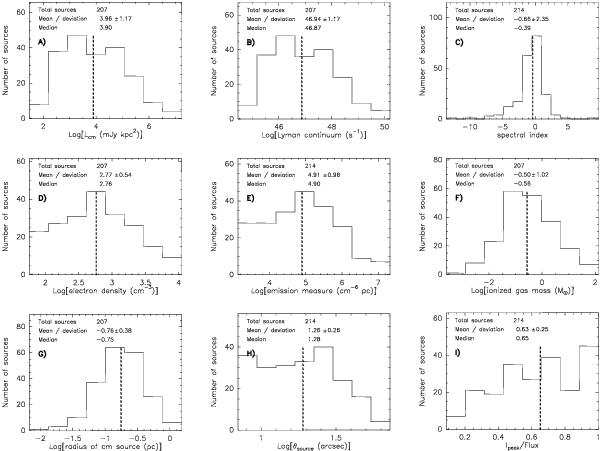
Distributions of a) centimeter luminosity; b) Lyman continuum; c) spectral index; d) electron density; e) emission measure; f) ionized gas mass; g) linear radius of the centimeter source; h) deconvolved angular diameter, θS; and i) peak intensity to flux density ratio, for the centimeter sources detected with ATCA. The numbers at the top of each panel indicate the total number of sources used in the histogram (in some cases we could only use 207 sources, i.e., those with distance determination), and the mean, standard deviation and median values. The vertical dashed line indicates the median value.
Current usage metrics show cumulative count of Article Views (full-text article views including HTML views, PDF and ePub downloads, according to the available data) and Abstracts Views on Vision4Press platform.
Data correspond to usage on the plateform after 2015. The current usage metrics is available 48-96 hours after online publication and is updated daily on week days.
Initial download of the metrics may take a while.