Fig. 2
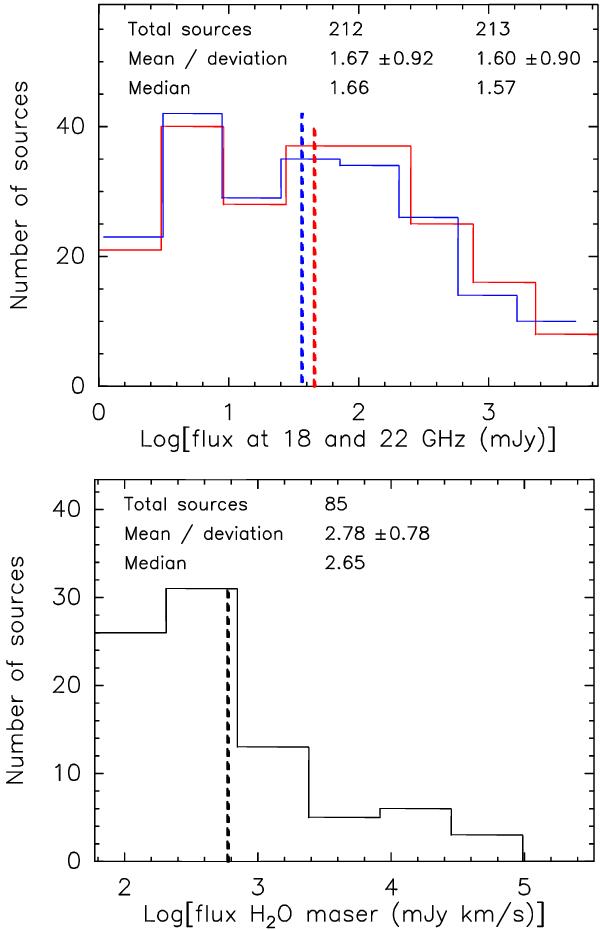
Top: distributions of the flux density of the centimeter continuum sources detected at 18.0 GHz (blue, 212 sources) and 22.8 GHz (red, 213 sources). Note that the number of sources detected at both wavelengths is different, since one source is detected only at 18.0 GHz and two sources are detected only at 22.8 GHz (see Table 3). Bottom: distribution of the integrated flux of the H2O maser emission. The numbers at the top of each panel correspond to the total number of sources, the mean, the standard deviation, and the median values.
Current usage metrics show cumulative count of Article Views (full-text article views including HTML views, PDF and ePub downloads, according to the available data) and Abstracts Views on Vision4Press platform.
Data correspond to usage on the plateform after 2015. The current usage metrics is available 48-96 hours after online publication and is updated daily on week days.
Initial download of the metrics may take a while.