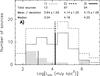
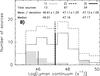
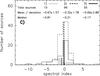
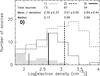
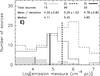
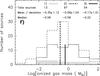
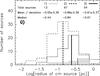
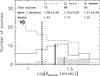
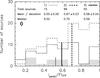
Fig. 13
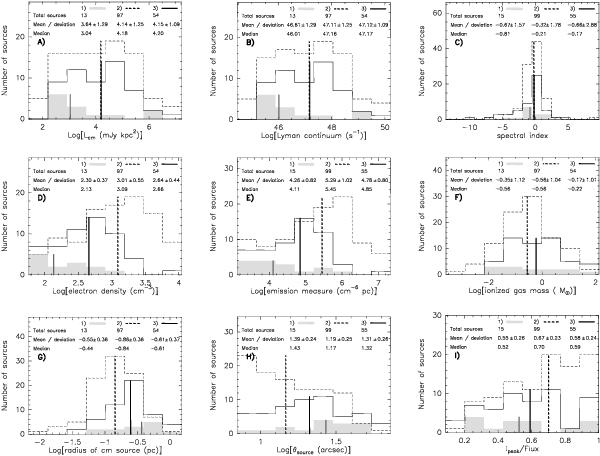
Distributions of a) centimeter luminosity; b) Lyman continuum; c) spectral index; d) electron density; e) emission measure; f) ionized gas mass; g) linear radius of the centimeter source; h) deconvolved angular diameter, θS; and i) peak intensity to flux density ratio, for the centimeter sources in the evolutionary stages Type 1 (gray filled), Type 2 (dashed line), and Type 3 (solid line). The numbers at the top of each panel are as in Fig. 3. The vertical thick lines indicate the median values.
Current usage metrics show cumulative count of Article Views (full-text article views including HTML views, PDF and ePub downloads, according to the available data) and Abstracts Views on Vision4Press platform.
Data correspond to usage on the plateform after 2015. The current usage metrics is available 48-96 hours after online publication and is updated daily on week days.
Initial download of the metrics may take a while.