Fig. 1
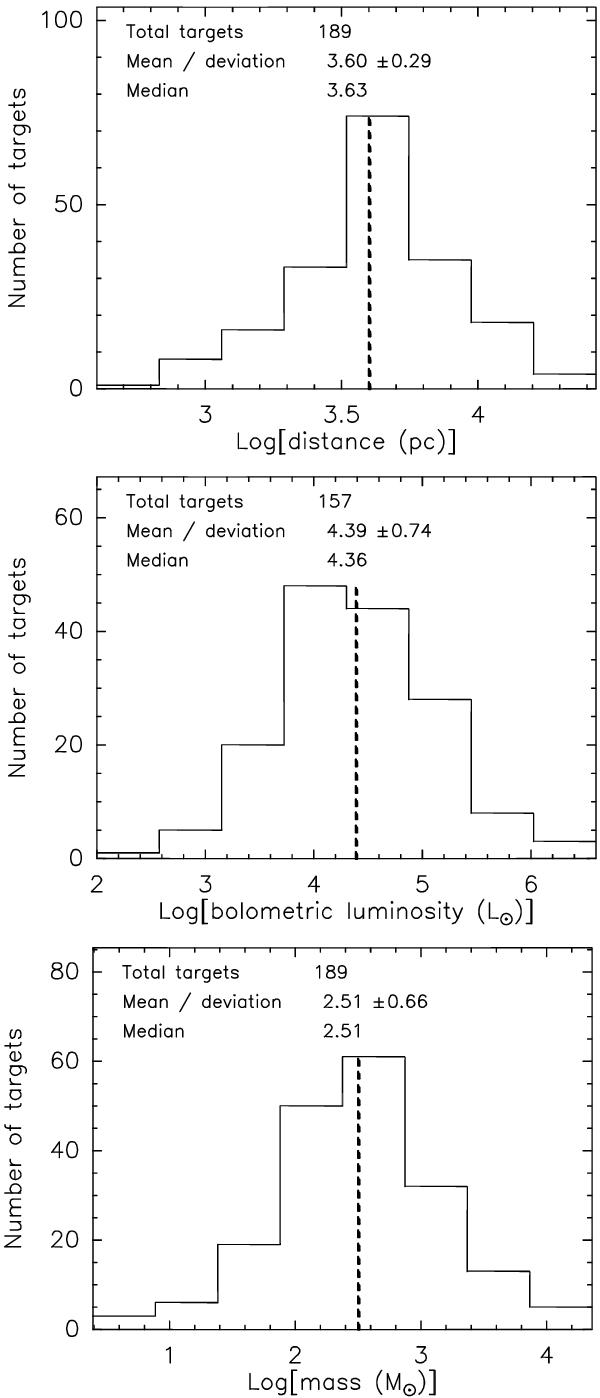
Top: distribution of kinematic distances for the observed fields (see Table 1 for references). Middle: distribution of bolometric luminosities for the fields centered on an IRAS source. Bottom: distribution of the sum of the masses of the millimeter sources within the observed fields (from Beltrán et al. 2006). At the top of each panel we indicate the total number of sources used in the histogram, the mean, the standard deviation, and the median. The vertical dashed lines indicate the median values.
Current usage metrics show cumulative count of Article Views (full-text article views including HTML views, PDF and ePub downloads, according to the available data) and Abstracts Views on Vision4Press platform.
Data correspond to usage on the plateform after 2015. The current usage metrics is available 48-96 hours after online publication and is updated daily on week days.
Initial download of the metrics may take a while.