Fig. 6
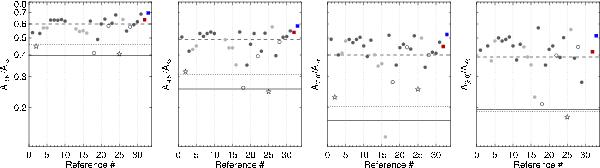
Extinction law for FeSt (blue filled squares) and B59 (red filled squares), in comparison with the extinction laws from the literature, shown for each IRAC band separately for clarity. The scale of the y-axes is the same for all panels. From left to right, Aλ/AKs for the IRAC bands [3.6], [4.5], [5.8], and [8.0] is shown for each reference in the literature. For the works not based on IRAC data the plotted values were the closest match in wavelength. The dark circles refer to extinction laws derived toward lines of sight containing dense regions, the light circles toward the diffuse medium, the open circles toward low (column) density lines of sight in the direction of star forming regions, and the star symbols toward regions dominated by outflows. Also shown are the Aλ/AKs values from the Draine (2003a,b) models for RV = 3.1 (solid line) and RV = 5.5 (dotted line), and the Weingartner & Draine (2001) models for RV = 5.5, case B (dashed line) for the corresponding wavelengths. All extinction laws are normalized to AH/AKs = 1.55. The references are as follows: (1) Lutz (1999); (2) Bertoldi et al. (1999) and Bertoldi et al. (1999); (3–5) Indebetouw et al. (2005) for RCW49; l = 284°; l = 42°; (6–10) Flaherty et al. (2007) for 2024/2023; 2068/2071; Serpens; Orion; Ophiuchus; (11–12) McClure (2009) for AKs < 1 mag; AKs > 1 mag; (13–16) Zasowski et al. (2009) for 10° < |l| < 15°; 30° < |l| < 40°; 50° < |l| < 60°; | l| > 90°; (17) Nishiyama et al. (2009); (18–21) Chapman et al. (2009) for 0 < AKs ≤ 0.5; 0.5 < AKs ≤ 1; 1 < AKs ≤ 2; AKs ≥ 2 mag; (22-25) Chapman & Mundy (2009) for 0 < AKs ≤ 0.5; 0.5 < AKs ≤ 1; AKs > 1 mag; regions with outflows; (26) Gao et al. (2009); (27) Fritz et al. (2011); (28–29) Olofsson & Olofsson (2011) for low and high column densities; (30–31) Cambrésy et al. (2011) for AV < 15 mag; AV > 20 mag; (32–33) This work for B59 and FeSt.
Current usage metrics show cumulative count of Article Views (full-text article views including HTML views, PDF and ePub downloads, according to the available data) and Abstracts Views on Vision4Press platform.
Data correspond to usage on the plateform after 2015. The current usage metrics is available 48-96 hours after online publication and is updated daily on week days.
Initial download of the metrics may take a while.